The Observational Medical Outcomes Partnership (OMOP) of the Foundation for the National Institute of Health (FNIH) researches methods for analysis of healthcare databases. One of their methods is "Bayesian Logistic Regression"
Here is their description of the method:
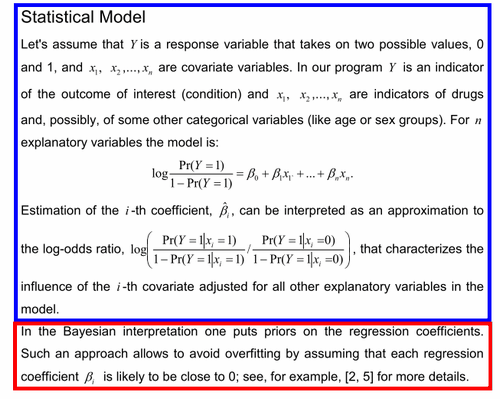
The blue box is a dichotomous Facets-type Rasch model with n+1 facets. n facets have two elements 0 and 1. The B0 facet has one element, non-centered.
The Red box is an artificial centralizing bias on the element measures. They could obtain a similar effect by using dummy weighted data in Facets.
Genkin, A., Lewis, D., Madigan, D., (2007). Large-Scale Bayesian Logistic Regression for Text Categorization, Technometrics, 49, 3, 291–304.
Example: with 2 covariates, x1, x2
Data from "Bayesian Logistic Regression for Medical Claims Data", Ivan Zorych, Patrick Ryan, David Madigan, 5-24-2010, The 33rd Annual Midwest Biopharmaceutical Statistics Workshop, Muncie, Indiana. www.mbswonline.com/upload/presentation_6-5-2010-6-23-40.pdf
Title=BLR
Newton = 0.5 ; use Newton-Raphson iteration
Converge = .000001, .0000001 ; with very tight convergence
Facets = 3
Noncenter = 1
Arrange = N
Models=
?,?,?,D ; Nausea (Y) =1, No nausea = 0
*
Keepzero=999
Labels=
1, Noncenter
1, B0
*
2, Rosinex (x1), A ; published size: B1 = 4.4
0, 0, 0 ; No Rosinex
1, B1 ; Rosinex
*
3, Ganclex (x2) , A ; published size: B2 = 0.0
0, 0, 0 ; No Ganclex
1, B2 ; Ganclex
*
Data=
R81, 1, 1, 1, 1 ; non-center, Rosinex, Ganclex, Nausea
R9, 1, 1, 1, 0
R1, 1, 0, 1, 1
R9, 1, 0, 1, 0
R9, 1, 1, 0, 1
R1, 1, 1, 0, 0
R90, 1, 0, 0, 1
R810,1, 0, 0, 0
; dummy data to centralize the estimates
; R3.5, 1, 1, 1, 1, 1, 1 ; weighting of 3.5 observations of Y=1
; R3.5, 1, 1, 1, 1, 1, 0 ; weighting of 3.5 observations of Y=0
