Select by clicking on "Cumulative Probabilities". Buttons are described in Graph window.
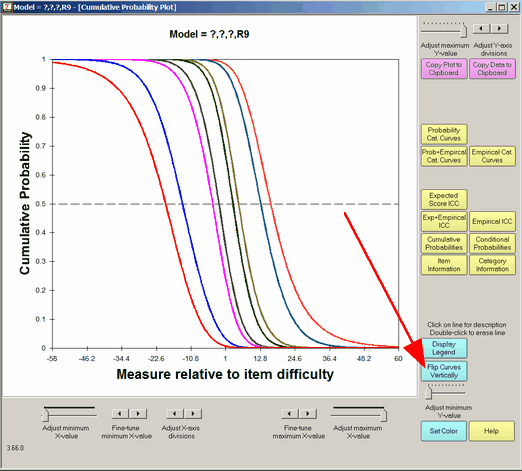
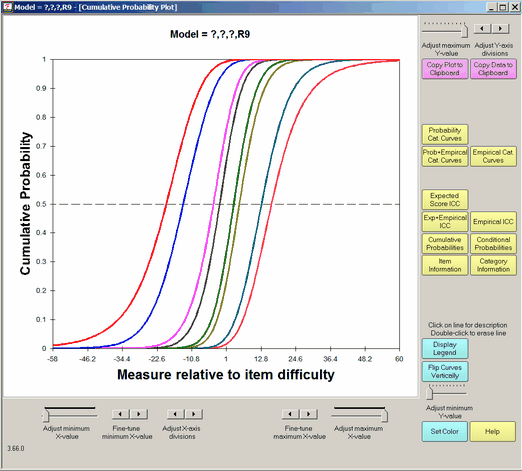
Lines: This shows the modeled category probability curves accumulated so that the left-hand curve (red) is the probability of being observed in the lowest category. The next curve to the right (blue) is the probability of being observed in the lowest or next lowest category. And so on further to the right.
Arrows: The points of intersection between these curves and the 0.5 probability line are the Rasch-Thurstone thresholds. The points at which being observed in this category (or below) and the category above (or higher) are equal. These curves are always in the order of the category scores.
Click on the "Flip Curves Vertically" button to change the vertical orientation of the curves.