The "Output Tables and Plots" menu allows you to report the measures after the analysis is completed. These Tables are in addition to those reported in the main run. They are put into separate files or displayed on your screen. Some Tables can also be displayed as Excel plots.
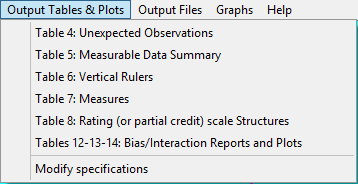
Table 4: Unexpected observations
Table 4 shows the most unexpected responses
Table 5: Measurable Data Summary
Table 5 reports summary statistics about the data for the analysis
Table 6: Vertical Rulers
Table 6.0 is the All facet summary - "rulers"
Table 6.0.0 is the Disjoint element listing
Table 6.2 Graphical description of facet statistics
Table 7: Measures
Table 7 is the facet measurement report
Table 7 reliability and chi-squared statistics
Table 8: Rating (or partial credit) scale Structures
Table 8.1 Dichotomy, binomial trial and Poisson statistics
Table 8.1 Rating scale (or partial credit) statistics
Table 8 Scale structure bar-chart
Table 8 Scale structure probability curves
Table 12-13-14: Bias/Interaction Report
Table 9 is the iteration report for bias estimation
Table 10 lists responses, still unexpected after allowing for bias
Table 11 shows how many responses were used to calculate bias estimates
Table 12 is the bias/interaction summary report
Table 13 is the bias/interaction report
and Excel DIF/bias plot (only from Output Tables pull-down menu)
Table 14 is the pairwise bias/interaction report
Modify Specifications allows modification of control specifications which affect general program output, but without requiring re-estimation.

