Click on "Category Probability Curves", also called Item Response Curves, IRCs
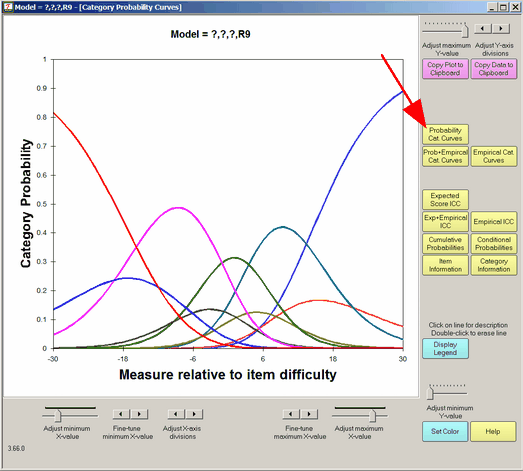
Select by clicking on "Probability Cat. Curves". Buttons are described in Graph window.
This shows the probability of observing each ordered category according to the Rasch model. To identify a category, click on it.
The caption can be clicked on and moved. "2" is the category score. "25% independent" is the category description from Rating Scale=. To clear the black highlighting, click somewhere else on the plot.
To delete the line corresponding to a category, double-click on it.
Poisson Curves
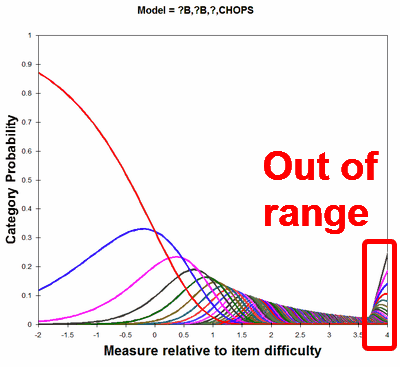
The Rasch-Poisson model has an infinity of categories. Facets computes 256 categories. Consequently measures are biased for observed categories above 200.
