Use the "Graphs" pull down menu to obtain these as bit-mapped plots.
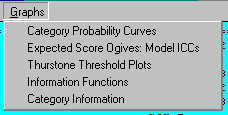
Specify "Graphfile=" to obtain the numbers to plot these yourself.
Table 8 includes a line-printer plot of the probability of occurrence for each category. The probability of the extreme categories always approaches 1.0 for corresponding extreme measures.
Most scale developers intend this to look like a series of hills, so that each category is in turn the most likely category along the latent variable.
Probability Curves
-3.0 -2.0 -1.0 0.0 1.0 2.0 3.0
++----------+----------+----------+----------+----------+----------++
1 | |
| |
|00 22|
| 00000 22222 |
| 000 222 |
P | 000 222 |
r | 00 22 |
o | 00 22 |
b | 000 222 |
a | 00 1111111 22 |
b | 0 11111 11111 2 |
i | 1** **1 |
l | 111 00 22 111 |
i | 11 00 22 11 |
t | 111 00 22 111 |
y | 111 00*22 111 |
| 1111 22 00 1111 |
| 1111 222 000 1111 |
|111 22222 00000 111|
| 22222222 00000000 |
0 |222222222222222 000000000000000|
++----------+----------+----------+----------+----------+----------++
-3.0 -2.0 -1.0 0.0 1.0 2.0 3.0
The expected score ogive shows the average rating value expected for any measure relative to the item, judge etc. The ogive also indicates the category "zone", e.g., the area between average ratings of 0.5 and 1.5 is marked by 1's plotted on the curve.
Expected Score Ogive
-2.0 -1.0 0.0 1.0 2.0 3.0
++------------+------------+------------+------------+------------++
2 | |
| 222222|
| 2222222 |
| 22222 |
| 22222 |
| 122 |
| 1111 |
| 111 |
| 11 |
| 111 |
1 | 111 |
| 111 |
| 11 |
| 111 |
| 1111 |
| 001 |
| 00000 |
|00000 |
| |
| |
0 | |
++------------+------------+------------+------------+------------++
-2.0 -1.0 0.0 1.0 2.0 3.0
Dichotomous plots always look the same:
Dichotomous scale structures are always the same:
