Winsteps can import and export files compatible with the R Statistics package. Many of the R procedures below can be actioned directly from Winsteps menus by one click, not requiring any knowledge of how to operate R.
The freeware R statistics package can be downloaded from www.r-project.org. Paul Murrell has posted useful instructional material online: https://www.stat.auckland.ac.nz/~paul/ - especially good for graphing.
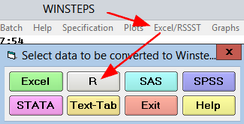
Launching Winsteps from R Statistics
Data Cornering suggests this R command:
1. > system("cmd.exe", input = paste('C:\\This\\Is\\Path\\Your.bat'))
2. Your.bat file is a Winsteps Batch= file
3. In the Winsteps control file in your.bat file, include TFILE= to output .txt and .rdata files for processing by R. Winsteps control and data files should be .txt files.
Winsteps calls to R statistics fail:
1. Check that file winsteps-zero.dat is in your c:\Winsteps folder along with Winsteps.exe
2. Close all open programs (apps). Go to your %temp% folder and delete all files that Windows will let you delete.
3. Launch R from its shortcut (not through Winsteps) and check that R operates correctly.
4. Launch R through Winsteps. Look at your %temp% folder. It should contain files winsteps-zero.rdata and .Rprofile
R command |
R's response |
Meaning |
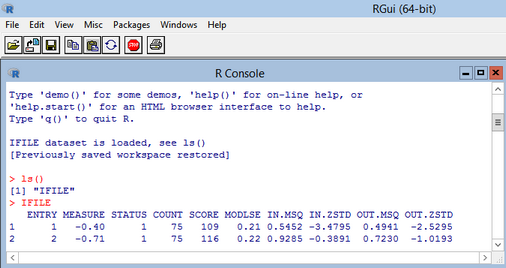
ls() |
[1] "IFILE" |
list of loaded datasets |
help(ls) |
Help windows opens |
help for "ls" command |
names(IFILE) |
[1] "ENTRY" "NAME" |
names of variables in the dataset "IFILE" |
IFILE |
(contents of IFILE) |
displays the data in the IFILE dataset |
attach(IFILE) |
- |
IFILE variables active without $ reference |
plot (x, y) |
scatterplot displays |
variable y is plotted against variable x |
q() |
(R terminates) |
quit (exit from) R Statistics |
Maximize your R Console window: edit your "Rconsole" file in "C:\Program Files\R\R-...\etc" from "# MDIsize = 0*0+0+0" to "MDIsize = 0*0+0+0" |
||
An R package to interface with Winsteps is also available from CRAN: Rwinsteps (Albano and Babcock) - cran.r-project.org/web/packages/Rwinsteps/index.html
Action: |
Screen: |
|
Import R statistics data in a .rdata or .rda file.
Now follow the procedure at Excel/RSSST menu. |
|
|
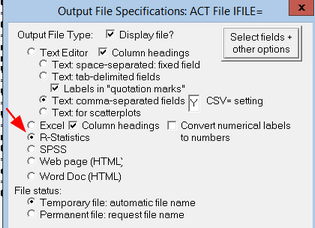
Export Winsteps output files as R statistics files: .rdata or ,rda
from the Output Files menu IFILE= PFILE= IPMATRIX=
Code for missing data: NA is usually applied automatically |
|
|
R Statistics screen
ls() at any time to see list of available objects, etc.
|
|
|
R functions |
data[data=="."] <- NA # Convert missing data to NA (R Statistics missing data code) |
|
Descriptive statistics |
> install.packages('psych'') > library (psych) > des <- describe(data) > print (des, digits=3) vars n mean sd median trimmed mad min max range skew kurtosis se Q0.25 Q0.75 ZSCORE 476 -0.009 0.827 -0.01 0.006 0.304 -5.969 6.141 12.11 -0.985 21.018 0.038 -0.163 0.21 |
|
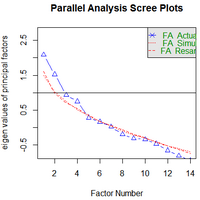
Principal Components Analysis and Factor analysis of standardized residuals or other numbers |
> install.packages('psych',''FactoMineR') > library (psych) > library (FactoMineR) > result <- fa.parallel (data) a Scree Plot displays of PCA and FA eigenvalues. R Console window: "Parallel analysis suggests that the number of factors = 3" Put 3 (or whatever) in the R "factors" instruction
Principal Components Analysis: > pca <- PCA(data, graph=FALSE) > pca$eig > pca$var$coord > head(pca$ind$coord)
Factor analysis: > factors <- fa(data, 3) > print (factors) the factor loadings are in columns MR1, MR2, ... > plot(factors) |
|
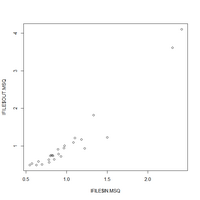
Simple plot with R |
Winsteps Output Files menu: IFILE=, PFILE=. Output to R Statistics. In R Statistics:
res -> attach(IFILE) res -> plot (IN.MSQ, OUT.MSQ) |
|
Use Winsteps Plots menu
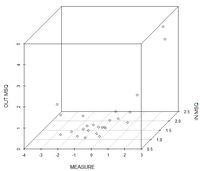
Winsteps Output Files menu: IFILE=, PFILE=: Select any 3 variables, e.g. Measure, Infit MnSq, Outfit MnSQ. Output to R Statistics In R Statistics: > install.packages("scatterplot3d") > library (scatterplot3d) > res <- scatterplot3d(IFILE)
|
|
|
Mokken scaling: Loevinger H Coefficient |
Output files menu: IPMATRIX= scored responses, no extreme scores. no person entry numbers, missing data = NA OK then when R displays: install.packages("mokken") library(mokken) coefH(data) |
|
Exploratory Factor Analysis (PCA) Functions for Assessing Dimensionality |
Output files menu: IPMATRIX= standardized residuals, no extreme scores, no person entry numbers, missing data = 0 install.packages("remotes") remotes::install_github("bpoconnor/paramap") library(paramap) MAP(data) |
|
CMLE Conditional Maximum Likelihood Estimation: Dichotomous
|
Output files menu: IPMATRIX= scored responses, no extreme scores. no person entry numbers, missing data = NA > install.packages("eRm") > library(eRm) # activate eRm > res <- RM(data) # CMLE estimation of item easinesses for dichotomies # RSM() and PCM() for polytomies > coef(res) # or summary(res) # report the items > pres <- person.parameter(res) # AMLE estimation of person abilities (thetas) > coef(pres) # or summary(pres) # report the person estimates > LRtest(res, splitcr = "median", se = TRUE) # Andersen's Likelihood Ratio Test (LRT) also > install.packages("RM.weights") > library (RM.weights) > res <- RM.w(data, .w = NULL, .d=NULL, country=NULL, se.control = TRUE, quantile.seq = NULL, write.file = FALSE, max.it=100) # dichotomies res <- PC.w(data, wt=NULL, extr=NULL, maxiter=100,minconv=.00001,country=NULL, write.file=FALSE, recode = 0, write.iteration=FALSE) # partial credit |
|
ERMA (Everyone's Rasch Measurement Analyzer) |
> install.packages("shiny") > library(shiny) > runGitHub("ShinyERMA", "RaschModel") Jue Wang (University of Miami) and George Engelhard Jr. (University of Georgia) |
|
JMLE Joint Maximum Likelihood Estimation: TAM |
Output files menu: IPMATRIX= scored responses start from zero, no extreme item scores. no person entry numbers, missing data = NA > install.packages("TAM") > library(TAM) # activate ltm > res <- tam.jml(data) > summary(res) # report the items |
|
MMLE Marginal Maximum Likelihood Estimation: Dichotomous |
Output files menu: IPMATRIX= scored responses, no extreme item scores. no person entry numbers, missing data = NA > install.packages("ltm") > library(ltm) # activate ltm > res <- rasch(data =data, constraint = cbind(ncol(data) + 1, 1)) > coef(res) # or summary(res) # report the items Generalized Partial Credit Model: > res <- gpcm(data, constraint = c("gpcm", "1PL", "rasch"), IRT.param = TRUE, start.val = NULL, na.action = NULL, control = list()) |
|
MMLE Marginal Maximum Likelihood Estimation: Dichotomous Polytomous, Rating Scale |
Output files menu: IPMATRIX= scored responses start from zero, no extreme item scores. no person entry numbers, missing data = NA > install.packages("TAM") > library(TAM) # activate TAM > res <- TAM::tam.mml( data, irtmodel="1PL" ) # dichotomous > res <- TAM::tam.mml( data, irtmodel="RSM" ) >summary(res) # report the items and thresholds >pers <- tam.mml.wle( res, score.resp=NULL, WLE=FALSE, adj=.3) # compute AMLE person thetas pers$theta # list the thetas |
|
PMLE Pair-wise Maximum Likelihood Estimation: dichotomous |
Output files menu: IPMATRIX= scored responses, no extreme scores. no person entry numbers, missing data = NA > install.packages("pairwise") > library(pairwise) # activate pairwise > res <- pair(data) > summary(res) and > install.packages("sirt") > library("sirt") > res <- rasch.pairwise(data) > summary(res) |
|
other Rasch packages |
> install.packages("mixRasch") > install.packages("pcIRT") >install.packages('mirt') > res <- mirt (data, 1, 'Rasch') # for dichotomous and partial credit analysis |
|
Use Winsteps Plots menu |
||
Receiver Operating Curve Area Under the Curve ROC AUC |
install.packages("PRROC") library(PRROC) res <- roc.curve(scores.class0 = XFILE$EXPECTATION, weights.class0=XFILE$ORDERED,curve=TRUE) plot(res) |
|
R Graphics ggplot2 |
Use Winsteps Graph window or > install.packages("ggplot2") > library(ggplot2) if this fails, then > remove.packages("ggplot2") then try again > data (diamonds) ? ggplot(diamonds, aes(x=carat, y=price)) |
|
Cluster Analysis with complete data |
install.packages ("pvclust") library(pvclust) data <- scale(data) fit <- pvclust(data, method.hclust="ward.D2", method.dist="euclidean") plot(fit) # dendogram with p values pvrect(fit, alpha=.95) # red boxes around significantly different clusters |
|
Generalizability Theory |
> remove.packages("Matrix") > install.packages("Matrix") > install.packages("gtheory") > library(Matrix) > library(gtheory)
#A univariate D study. #Compare to results on page 116 of Brennan (2001). data(Brennan.3.2) formula.Brennan.3.2 <- "Score ~ (1 | Person) + (1 | Task) + (1 | Rater:Task) + (1 | Person:Task)" gstudy.out <- gstudy(data = Brennan.3.2, formula = formula.Brennan.3.2) dstudy(gstudy.out, colname.objects = "Person", data = Brennan.3.2, colname.scores = "Score") #A multivariate D study. #Compare to results on pages 270-272 of Brennan (2001). data(Rajaratnam.2) formula.Rajaratnam.2 <- "Score ~ (1 | Person) + (1 | Item)" gstudy.out <- gstudy(data = Rajaratnam.2, formula = formula.Rajaratnam.2, colname.strata = "Subtest", colname.objects = "Person") dstudy(gstudy.out, colname.objects = "Person", data = Rajaratnam.2, colname.scores = "Score", colname.strata = "Subtest", weights = c(0.25, 0.5, 0.25)) |
|