controlled by T1SCORE=, IPEXTREME=, MTICK=, NAMLMP=, IMAP=, PMAP=, ISORT=, PSORT. There are more options at TFILE=, see also MTOP=
For size: MAXPAGE=, LINELENGTH=, MRANGE=
Ben Wright usually drew his maps vertically with item and person labels (like Winsteps Table 1). Ben's maps were intended to tell us about what it means to be at a specific location on the latent variable in terms of what you can do and who can do it.
Table 1.0 Wright map - person and item labels on one page
MEASURE KID - MAP - TAP <more>|<rare> 5 + 1-3- 1-4- 1-4- 4-1- | 4 T+ Mik Tra |S 1-4- 3 Bla + | 2 Dav Rod Wal Zul S+ 1-3- 1-4- | 1 Aud Jam Kim Ron Wil + 1-3- | 0 M+M Ann Bre Don Dor Hel Jan Joe Lis Mar Pet Ric Tho | -1 + Bet Els Sus | 2-4- -2 Ber Bri S+ | 1-4- -3 Ada Ric + Bar Car |S 1-3- 3-4- -4 T+ 1-4- 2-1- Lin | 1-3- -5 Fra + 1-2- 1-4 2-3 <less>|<freq>
Column Labels for Tables 1.0, 1.1, 1.2, 1.4 |
Table 1.0 is printed, if person and item maps can be squeezed into one page. MAXPAGE= controls height of table (number of lines for each logit). LINELENGTH= controls width of table. Typical defaults are MAXPAGE=50, LINELENGTH=80. Use the Specification menu dialog box to try different values.
Left-hand column locates the person ability measures along the variable. The persons often have a normal distribution.
Right-hand column locates the item difficulty measures along the variable. Table 12 has the full item labels. Items arranged by measure: look for the hierarchy of item names to spell out a meaningful construct from easiest at the bottom to hardest at the top.
M,S,T are the Mean, 1 and 2 Standard Deviations from the Mean for the persons and items. With IPEXTREME=Yes (the default), persons and items with extreme scores are placed at the ends of the map and are excluded from M,S,T. With IPEXTREME=No, persons and items with extreme scores are placed at their measures on the map and are included in M,S,T.
For dichotomous items, look for an even spread of items along the variable (the y-axis) with no gaps. Gaps can indicate poorly defined or poorly tested regions of the variable. Good tests usually have the items targeted (lined up with) the persons.
For polytomous items, Table 2.2 shows the operational range of the item with its rating scale.
You can use IMAP= and PMAP= to choose parts of labels to show. NAMLMP= limits the number of characters of each name reported. LINELENGTH= changes the available space on the line. MAXPAGE= controls the length of the Table. MRANGE= controls the displayed range of measures. ISORT= and PSORT= control the sort order within rows.
For the full person labels, please use Table 16. For the full item labels, please use Table 12. |
Table 1.1 Wright map - person and item distributions
SCORE MEASURE | MEASURE <more> --------------------- KID -+- TAP ----------------- <rare> 5 + X 5 15 | XXX | 4 + 4 14 XX T| |S X 13 3 X + 3 | | X 12 2 XXXX + X 2 S| | 11 1 XXXXX + 1 | X | 0 +M 0 10 XXXXXXXXXXXX M| | -1 + -1 9 XXX | | X -2 S+ -2 8 XX | X | 7 -3 XX + -3 |S XX 6 XX | XX -4 T+ -4 5 X | X | -5 X + XXX -5 <less> --------------------- KID -+- TAP ----------------- <freq> |
This table shows the distribution of the persons and items. The variable is laid out vertically with the most able persons, and most difficult items at the top.
Left-hand columns locate the person raw scores and ability measures along the variable.
Right-hand column locates the item difficulty measures along the variable.
SCORE (raw score on active items) shown in Table 1 sub-tables when T!SCORE=Yes
|
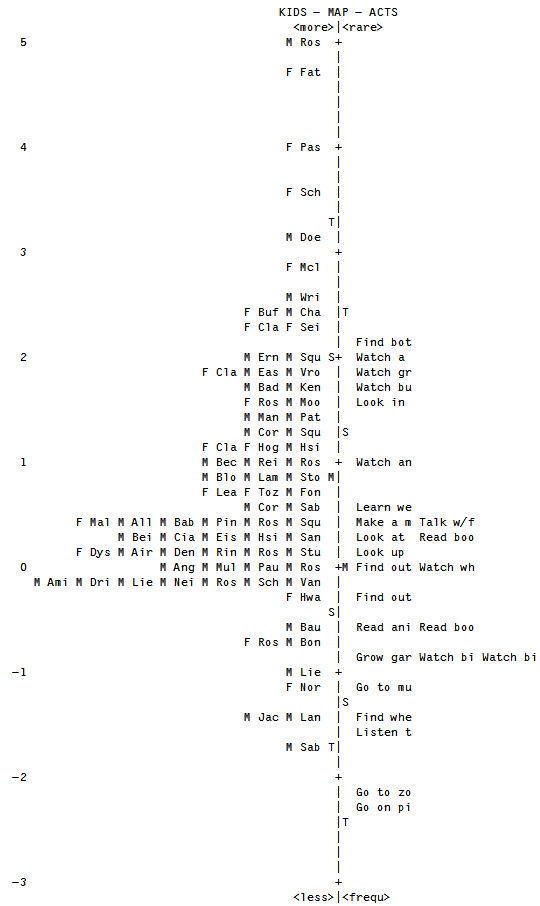
Table 1.2 Wright map - person distribution + item labels
MEASURE KID - MAP - ACT <more>|<rare> 5 . + . | | 4 . + . | . T| 3 . + . |T ## | FIND BOTTLES AND WATCH A RAT 2 .## S+ ## | LOOK IN SIDEWALK WATCH BUGS WATCH GRASS CHANG .### |S 1 .#### M+ WATCH ANIMAL MOVE .## | LEARN WEED NAMES MAKE A MAP TALK W/FRIENDS AB ####### | LOOK AT PICTURES LOOK UP STRANGE A READ BOOKS ON PLA 0 .##### +M FIND OUT WHAT ANI WATCH WHAT ANIMAL # S| FIND OUT WHAT FLO READ ANIMAL STORI WATCH BIRDS # | READ BOOKS ON ANI -1 # + FIND WHERE ANIMAL WATCH BIRD MAKE N # |S GROW GARDEN LISTEN TO BIRD SI . T| -2 + GO TO MUSEUM | GO TO ZOO |T -3 + GO ON PICNIC <less>|<freq> EACH "#" IS 2: EACH "." IS 1 |
Left-hand column locates the person ability measures along the variable. The persons often have a normal distribution.
Right-hand column locates the item difficulty measures along the variable. The item labels are abbreviated to fit on one page. Table 12 has the full item labels.
Effective operational range of an instrument with dichotomous items. Table 1.2 is enough if the data are dichotomies. Then each item has an operational range of about 1.5 logits up and down from the item difficulty. For an ability at 1.5 logits from the difficulty of a dichotomous item, the response to the item contain about 60% of the statistical information of a response for an ability equal to the item difficulty.
In Table 1.2 the X's are located at the point where there is a 50% chance of being observed in the bottom category and a 50% chance of being observed in the top category. For dichotomies, there are only 2 categories, so this is the whole story. |
Table 1.3 Wright map - item distribution + person labels
MEASURE ACT - MAP - KID <rare>|<more> 5 + M | F | 4 + F | F |T M 3 + F T| M XX | F F F M 2 +S F M M M M XXX | F M M M S| F F M M M M M 1 X +M F F M M M M M M M XXX | M M M M M XXX | F F M M M M M M M M M M M M 0 XX M+ M M M M M M M M M M M XXX |S F M X | F M -1 XX + F M XX S| M M |T M -2 X + X | T| -3 X + <freq>|<less> |
Left-hand column shows the item difficulty distribution measures along the variable.
Right-hand column locates the person ability measures along the variable. The persons often have a normal distribution. The person labels are abbreviated to fit on one page. Table 16.3 shows the full person labels
|
Table 1.4 Wright map - person and item distributions + polytomous item range
MEASURE | BOTTOM P=50% | MEASURE | TOP P=50% MEASURE <more> ----- KID -+- ACT -+- ACT -+- ACT <rare> 5 . + + + 5 . | | | | | | 4 . + + + 4 . | | | . | | | XX 3 . + D + D + D 3 . | | | XXX ## | | XX | 2 .## + + + X 2 ## | | XXX | XXX .### | XX | | XXX 1 .#### + + X + XX 1 .## | XXX | XXX | XXX ####### | | XXX | X 0 .##### + X + XX + XX 0 # | XXX | XXX | XX # | XXX | X | -1 # + XX + XX + X -1 # | XXX | XX | X . | X | | -2 + XX + X + X -2 | XX | X | | | | -3 + X + X + -3 | X | | | | | -4 + X + + -4 | | | | | | -5 + + + -5 <less> ----- KID -+- ACT -+- ACT -+- ACT <freq> EACH "#" IN THE KID COLUMN IS 2 KID: EACH "." IS 1 |
Table 1.4 is only produced when there are polytomous items. Table 1.4 shows the distribution of the person MEASUREs and items. The variable is laid out vertically with the most able persons, and most difficult items at the top. Each person or polytomous item is indicated by an "X", or, when there are too many "X"s to display on one line, several persons or items are represented by a "#". Less than that number by ".". So that if "#" represents 4, then "." represents 1 to 3. Each item is shown three times in Table 1.4. Dichotomous items, "D", have only one location, the same in all three item columns.
In the center item column, "MEASURE", each item is placed at its item difficulty measure (in Table 13.1, etc).
In the left-hand item column,"BOTTOM", the item is shown at the measure level (Rasch-Thurstonian threshold) corresponding to a probability of .5 of exceeding (or being rated in) the bottom rating (or partial credit) scale category.
In the right-hand item column, "TOP", the item is shown at the measure level corresponding to a probability of .5 of being rated in (or falling below) the top rating (or partial credit) scale category.
The plotted values are in the ISFILE=. These locations are also shown in Table 2.3.
The left-hand column locates the person ability measures along the variable. Observe that the top pupil (top . in left column and green band) is well above the top category of the most difficult act items (top XX in right-most column and top red band), but that all pupils are above the top category of the easiest item (bottom X in right-most column and blue band). "Above" here means with greater than 50% chance of exceeding.
Effective operational range of an instrument with polytomous items. In Table 1.4, everyone between the extreme Rasch-Thurstonian thresholds = 50% cumulative thresholds (red bands in the Figure) has a more than 50% chance of being rated above the bottom category of at least one item and below the top category of at least one item. Here we have polytomies (rating scale, partial credit), so each item has a range from the bottom category of the rating scale (2nd column in Table 1.4) through the overall item difficulty (3rd column in Table 1.4) to the top category of the rating scale (4th column Table 1.4).
In Table 1.4, the X's in the 2nd column are located at the points on the latent variable where a person would have a 50% chance of being observed in the bottom category and a 50% chance of being observed in a higher category. So this is like the "item difficulty" of the bottom category.
In Table 1.4, the X's in the 4th column are located at the points on the latent variable where a person would have a 50% chance of being observed in the top category and a 50% chance of being observed in a lower category. So this is like the "item difficulty" of the top category.
So the item difficulty of each item covers the whole range in Table 1.4 from its X in the 2nd column to its X in the 4th column. |
Polytomies: Tables 1.5 - 1.8 - which to report? Think: what is my message to my audience? See Category Boundaries and Thresholds
Table 1.5 - Rasch-half-point thresholds work best when you need to show average ratings at each point on the rating scale. This works well with people familiar with conventional statistical analysis.
Table 1.6 - Rasch-Thurstonian thresholds are best when you need the equivalent of dichotomizing the rating scale at each category boundary = is the person above or below this boundary? - www.rasch.org/rmt/rmt233e.htm - This is used in reporting to parents in Australia.
Table 1.7 - Andrich-Thresholds are best when you need to show which individual category is most probable at each point along the latent variable. They become confusing when thresholds are disordered. This is often used in clinical situations when the user needs to know what behavior is more likely to be seen.
Table 1.8 - Category centers. The locations on the latent variable at which each category is most probable = points at which the expected score on the item is the category value = a center of each category. This is useful when you need to report how the rating scale categories "step up" the latent variable. |
Table 1.5 Item map with expected score zones
MEASURE KID - MAP - ACT - Expected score zones (Rasch-half-point thresholds) <more>|<rare> Neutral Like 5 # + | 4 . + . T| FIND BOTTLES AND CANS .15 3 # +T WATCH A RAT .15 WATCH BUGS .15 WATCH GRASS CHANGE .15 .## | LOOK IN SIDEWALK CRACKS .15 2 .### S+ WATCH ANIMAL MOVE .15 ### |S FIND BOTTLES AND CANS .05 LEARN WEED NAMES .15 LOOK AT PICTURES OF PLANTS .15 LOOK UP STRANGE ANIMAL OR PLAN.15 MAKE A MAP .15 READ BOOKS ON PLANTS .15 TALK W/FRIENDS ABOUT PLANTS .15 1 ###### M+ WATCH A RAT .05 FIND OUT WHAT ANIMALS EAT .15 WATCH BUGS .05 WATCH WHAT ANIMALS EAT .15 .######### | LOOK IN SIDEWALK CRACKS .05 FIND OUT WHAT FLOWERS LIVE ON .15 WATCH GRASS CHANGE .05 READ ANIMAL STORIES .15 READ BOOKS ON ANIMALS .15 WATCH BIRDS .15 0 ###### +M WATCH ANIMAL MOVE .05 FIND WHERE ANIMAL LIVES .15 WATCH BIRD MAKE NEST .15 .# S| LEARN WEED NAMES .05 GROW GARDEN .15 LOOK AT PICTURES OF PLANTS .05 LISTEN TO BIRD SING .15 LOOK UP STRANGE ANIMAL OR PLAN.05 MAKE A MAP .05 READ BOOKS ON PLANTS .05 TALK W/FRIENDS ABOUT PLANTS .05 -1 # + FIND OUT WHAT ANIMALS EAT .05 GO TO MUSEUM .15 WATCH WHAT ANIMALS EAT .05 .# T|S FIND OUT WHAT FLOWERS LIVE ON .05 GO TO ZOO .15 READ ANIMAL STORIES .05 READ BOOKS ON ANIMALS .05 WATCH BIRDS .05 -2 + FIND WHERE ANIMAL LIVES .05 GO ON PICNIC .15 WATCH BIRD MAKE NEST .05 | GROW GARDEN .05 LISTEN TO BIRD SING .05 -3 +T GO TO MUSEUM .05 | GO TO ZOO .05 -4 + GO ON PICNIC .05 | -5 + <less>|<freq> Dislike Neutral |
Table 1.5 is only produced when there are polytomous items.
The right-hand column shows the items positioned at the lower edge of each expected score zone (the half-point thresholds). The half-point threshold for category c is indicated by .c5 when ASCII=Yes or .c½ when ASCII=No or ASCII=Web. The expected score zone above item-label .05 extends from expected category score 0.5 to 1.5 at item-label .15. Lower than item-label .05 is the zone from 0 to 0.5. These correspond to the thresholds on the Expected Score ICC.
If you put the item number at the start of the item labels after &END, you can show only the item numbers on this plot by using NAMLMP= or IMAP=. Column headings are the category labels that match the (rescored) category numbers in CFILE= or CLFILE=.
Where there are more items than can be shown on one line, the extra items are printed on subsequent lines, but the latent variable "|" does not advance and is left blank. The plotted values are in the ISFILE=.
Left-hand column shows the distribution of person ability measures along the variable.
Column labels in Tables 1.5, 1.6, 1.7, 1.8 |
Table 1.6 Item map with 50% cumulative probabilities (Rasch-Thurstonian thresholds)
MEASURE KID - MAP - ACT - 50% Cumulative probabilities (Rasch-Thurstonian thresholds) <more>|<rare> Neutral Like 5 # + | 4 . + . T| FIND BOTTLES AND CANS .2 3 # +T WATCH A RAT .2 WATCH BUGS .2 WATCH GRASS CHANGE .2 .## | LOOK IN SIDEWALK CRACKS .2 2 .### S+ WATCH ANIMAL MOVE .2 ### |S FIND BOTTLES AND CANS .1 LEARN WEED NAMES .2 LOOK AT PICTURES OF PLANTS .2 LOOK UP STRANGE ANIMAL OR PLANT.2 MAKE A MAP .2 READ BOOKS ON PLANTS .2 TALK W/FRIENDS ABOUT PLANTS .2 1 ###### M+ WATCH A RAT .1 FIND OUT WHAT ANIMALS EAT .2 WATCH BUGS .1 WATCH WHAT ANIMALS EAT .2 .######### | LOOK IN SIDEWALK CRACKS .1 FIND OUT WHAT FLOWERS LIVE ON .2 WATCH GRASS CHANGE .1 READ ANIMAL STORIES .2 READ BOOKS ON ANIMALS .2 WATCH BIRDS .2 0 ###### +M WATCH ANIMAL MOVE .1 FIND WHERE ANIMAL LIVES .2 WATCH BIRD MAKE NEST .2 .# S| LEARN WEED NAMES .1 GROW GARDEN .2 LOOK AT PICTURES OF PLANTS .1 LISTEN TO BIRD SING .2 LOOK UP STRANGE ANIMAL OR PLANT.1 MAKE A MAP .1 READ BOOKS ON PLANTS .1 TALK W/FRIENDS ABOUT PLANTS .1 -1 # + FIND OUT WHAT ANIMALS EAT .1 GO TO MUSEUM .2 WATCH WHAT ANIMALS EAT .1 .# T|S FIND OUT WHAT FLOWERS LIVE ON .1 GO TO ZOO .2 READ ANIMAL STORIES .1 READ BOOKS ON ANIMALS .1 WATCH BIRDS .1 -2 + FIND WHERE ANIMAL LIVES .1 GO ON PICNIC .2 WATCH BIRD MAKE NEST .1 | GROW GARDEN .1 LISTEN TO BIRD SING .1 -3 +T GO TO MUSEUM .1 | GO TO ZOO .1 -4 + GO ON PICNIC .1 | -5 + <less>|<freq> Dislike Neutral EACH "#" IS 2: EACH "." IS 1
|
Table 1.6 is only produced when there are polytomous items.
The right-hand column shows the items positioned at median 50% cumulative probability (the Rasch-Thurstonian thresholds) at the lower edge of each rating probability zone. Above label.1, categories 1 and above are more probable. Below label.2, categories 1 and below are most probable. Between label.1 and label.2 is the zone which can be thought of as corresponding to a rating of 1. These correspond to the Cumulative Probability thresholds.
If you put the item number at the start of the item labels after &END, you can show only the item numbers on this plot by using NAMLMP= or IMAP=. Columns are headed by the (rescored) categories in CFILE=.
Where there are more items than can be shown on one line, the extra items are printed on subsequent lines, but the latent variable "|" does not advance and is left blank. The plotted values are in the ISFILE=.
Left-hand column shows the distribution of person ability measures along the variable. |
Table 1.7 Item map with Andrich thresholds (modal categories if ordered)
MEASURE KID - MAP - ACT - Andrich thresholds (modal categories if ordered) <more>|<rare> Neutral Like 5 . + . | | 4 . + . | . T| FIND BOTTLES AND CANS .2 3 . + WATCH A RAT .2 . |T LOOK IN SIDEWALK CRACKS .2 WATCH BUGS .2 WATCH GRASS CHANGE .2 ## | 2 .## S+ WATCH ANIMAL MOVE .2 ## | FIND BOTTLES AND CANS .1 LEARN WEED NAMES .2 .### |S WATCH A RAT .1 LOOK AT PICTURES OF PLANTS .2 MAKE A MAP .2 READ BOOKS ON PLANTS .2 TALK W/FRIENDS ABOUT PLANTS .2 1 .#### M+ WATCH BUGS .1 FIND OUT WHAT ANIMALS EAT .2 WATCH GRASS CHANGE .1 LOOK UP STRANGE ANIMAL OR PLANT.2 WATCH WHAT ANIMALS EAT .2 .## | LOOK IN SIDEWALK CRACKS .1 FIND OUT WHAT FLOWERS LIVE ON .2 ####### | WATCH ANIMAL MOVE .1 READ ANIMAL STORIES .2 WATCH BIRDS .2 0 .##### +M LEARN WEED NAMES .1 FIND WHERE ANIMAL LIVES .2 READ BOOKS ON ANIMALS .2 WATCH BIRD MAKE NEST .2 # S| LOOK AT PICTURES OF PLANTS .1 GROW GARDEN .2 MAKE A MAP .1 READ BOOKS ON PLANTS .1 TALK W/FRIENDS ABOUT PLANTS .1 # | FIND OUT WHAT ANIMALS EAT .1 LISTEN TO BIRD SING .2 LOOK UP STRANGE ANIMAL OR PLANT.1 WATCH WHAT ANIMALS EAT .1 -1 # + # |S FIND OUT WHAT FLOWERS LIVE ON .1 GO TO MUSEUM .2 READ ANIMAL STORIES .1 WATCH BIRDS .1 . T| FIND WHERE ANIMAL LIVES .1 GO TO ZOO .2 READ BOOKS ON ANIMALS .1 WATCH BIRD MAKE NEST .1 -2 + GROW GARDEN .1 | LISTEN TO BIRD SING .1 GO ON PICNIC .2 |T -3 + GO TO MUSEUM .1 | GO TO ZOO .1 | -4 + GO ON PICNIC .1 | | -5 + <less>|<freq> Dislike Neutral EACH "#" IS 2: EACH "." IS 1
|
Table 1.7 is only produced when there are polytomous items.
The right-hand column shows the items positioned at their Andrich thresholds (points of equal probability of adjacent categories) at the lower edge of each rating probability zone. When the thresholds are ordered, above label.2, the most probable category is 2. Below label.1, the most probable category is 0. Between label.1 and label.2 is the zone which can be thought of as corresponding to a rating of 1.
If you put the item number at the start of the item labels after &END, you can show only the item numbers on this plot by using NAMLMP= or IMAP=. Columns are headed by the (rescored) categories in CFILE=.
Where there are more items than can be shown on one line, the extra items are printed on subsequent lines, but the latent variable "|" does not advance and is left blank. The plotted values are in the ISFILE=.
Left-hand column shows the distribution of person ability measures along the variable. |
Table 1.8 Item map of measures for category scores (maximum probability of observing a category)
MEASURE KID - MAP - ACT - Measures for category scores (maximum probability of observing a category) <more>|<rare> Dislike Neutral Like 5 X + X | | | Find bottles .2 | Watch a rat .2 4 X + Watch bugs .2 | Look in side .2 Watch grass .2 X | T| X | Watch animal .2 3 X + X |T Learn weed n .2 | Make a map .2 Talk w/frien .2 XX | Find bottles .1 Look at pict .2 Look up stra .2 Read books o .2 XXXX S| Watch a rat .1 Find out wha .2 Watch what a .2 2 XXX + XX | Watch bugs .1 Find out wha .2 Watch grass .1 XX | Look in side .1 Read animal .2 Watch birds .2 XXXX |S Read books o .2 XXX | Watch animal .1 Find where a .2 Watch bird m .2 1 XXXXXX + XXXXX M| Learn weed n .1 Grow garden .2 XXX | Make a map .1 Listen to bi .2 Talk w/frien .1 XXXXXXXX | Find bottles .0 Look at pict .1 Look up stra .1 Read books o .1 XXXXXXXXXX | Watch a rat .0 Watch what a .1 0 XXXXXXX +M Find out wha .1 Go to museum .2 X | Watch bugs .0 X S| Look in side .0 Find out wha .1 Go to zoo .2 Watch grass .0 Read animal .1 Watch birds .1 XX | | Read books o .1 Watch bird m .1 -1 XX + Watch animal .0 Find where a .1 Go on picnic .2 | Grow garden .1 XX |S Learn weed n .0 Listen to bi .1 Make a map .0 X T| Look at pict .0 Read books o .0 Talk w/frien .0 | Look up stra .0 -2 + Find out wha .0 Go to museum .1 Watch what a .0 | | Find out wha .0 Go to zoo .1 Watch birds .0 | Read animal .0 |T Read books o .0 -3 + Find where a .0 Watch bird m .0 | Go on picnic .1 | Grow garden .0 | Listen to bi .0 | -4 + | Go to museum .0 | | Go to zoo .0 | -5 + | Go on picnic .0 | | | -6 + <less>|<freq> Dislike Neutral Like
|
Table 1.8 is only produced when there are polytomous items.
The right-hand column shows the items positioned at the measures where the expected score on the item = the category number. This is also the measure at which the category has its highest probability. Extreme categories are shown at measures corresponding to the category score adjustedby .25 score points (or LOWADJ= and HIADJ=) .
If you put the item number at the start of the item labels after &END, you can show only the item numbers on this plot by using NAMLMP= or IMAP=. Columns are headed by the (rescored) categories in CFILE=.
Where there are more items than can be shown on one line, the extra items are printed on subsequent lines, but the latent variable "|" does not advance and is left blank. The plotted values are in the ISFILE=.
Left-hand column shows the distribution of person ability measures along the variable. |
Table 1.9 Item map of average person measure for each category score
MEASURE PUPIL - MAP - PUPIL - Average Measures for category scores <more>|<more> like 3 4 5 X + X | | | | 4 X + | X | T| X | 3 X + WATCH GRASS CHAN.4 LOOK IN SIDEWALK.4 X |T | XX | WATCH BUGS.4 WATCH ANIMAL MOV.4 XXXX S| READ BOOKS ON PL.4 TALK W/FRIENDS A.4 2 XXX + LOOK AT PICTURES.4 MAKE A MAP.4 WATCH WHAT ANIMA.4 LEARN WEED NAMES.4 LOOK UP STRANGE.4 XX | FIND OUT WHAT AN.4 WATCH BIRDS.4 XX | READ ANIMAL STOR.4 FIND OUT WHAT FL.4 FIND WHERE ANIMA.4 READ BOOKS ON AN.4 WATCH BIRD MAKE.4 XXXX |S LISTEN TO BIRD S.4 FIND BOTTLES AND.4 XXX | GROW GARDEN.4 GO TO MUSEUM.4 GO TO ZOO.4 1 XXXXXX + GO TO ZOO.2 WATCH GRASS CHAN.3 GO ON PICNIC.4 WATCH A RAT.2 WATCH A RAT.3 FIND BOTTLES AND.2 WATCH BUGS.3 XXXXX M| FIND BOTTLES AND.3 WATCH A RAT.4 WATCH ANIMAL MOV.3 XXX | LOOK IN SIDEWALK.2 MAKE A MAP.3 WATCH BUGS.2 LOOK IN SIDEWALK.3 LOOK UP STRANGE.3 LEARN WEED NAMES.3 LOOK AT PICTURES.3 TALK W/FRIENDS A.3 READ BOOKS ON PL.3 XXXXXXXX | GO ON PICNIC.2 WATCH WHAT ANIMA.3 FIND OUT WHAT AN.3 FIND OUT WHAT FL.3 XXXXXXXXXX | WATCH GRASS CHAN.2 WATCH BIRDS.3 LEARN WEED NAMES.2 READ ANIMAL STOR.3 WATCH ANIMAL MOV.2 0 XXXXXXX +M MAKE A MAP.2 READ BOOKS ON AN.3 LISTEN TO BIRD S.3 GO ON PICNIC.3 FIND WHERE ANIMA.3 GROW GARDEN.3 WATCH BIRD MAKE.3 X | TALK W/FRIENDS A.2 LOOK AT PICTURES.2 X S| FIND OUT WHAT AN.2 GO TO MUSEUM.3 LOOK UP STRANGE.2 READ BOOKS ON PL.2 READ ANIMAL STOR.2 FIND OUT WHAT FL.2 WATCH BIRD MAKE.2 READ BOOKS ON AN.2 WATCH WHAT ANIMA.2 XX | GROW GARDEN.2 GO TO ZOO.3 | FIND WHERE ANIMA.2 WATCH BIRDS.2 -1 XX + | XX |S LISTEN TO BIRD S.2 X T| | -2 + <less>|<freq> Dislike Neutral Like
|
Table 1.9 is only produced when there are polytomous items.
The right-hand column shows the categories of the items positioned by the average of the measures of the persons who responded in each category.
If you put the item number at the start of the item labels after &END, you can show only the item numbers on this plot by using NAMLMP= or IMAP=. Columns are headed by the (rescored) categories in CFILE=.
Where there are more items than can be shown on one line, the extra items are printed on subsequent lines, but the latent variable "|" does not advance and is left blank. The plotted values are in the ISFILE=.
Left-hand column shows the distribution of person ability measures along the variable. |
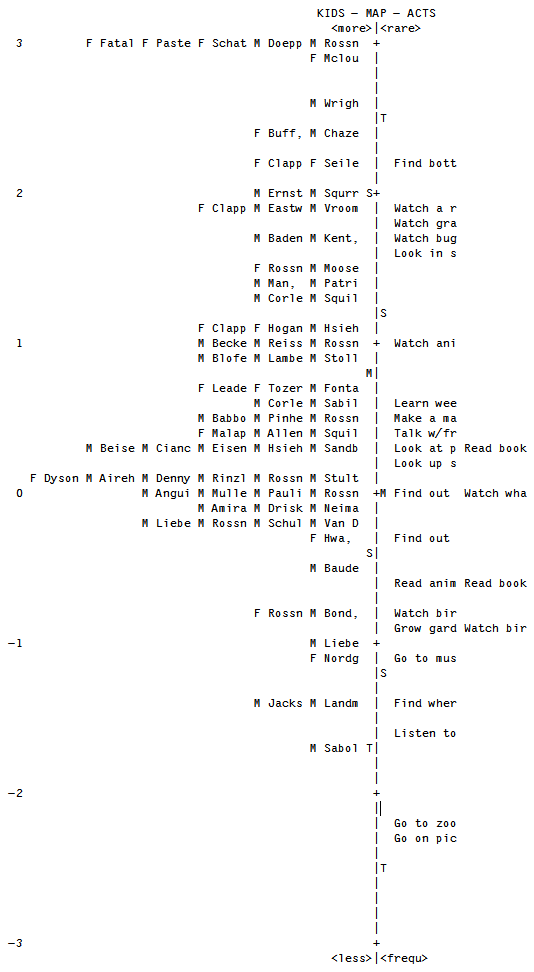
Table 1.10 Wright map - person and item (by easiness) labels on one page
MEASURE KID - MAP - ACT <more>||<freq> 5 M R ++ F F || || 4 F P ++ F S || M D T|| 3 F M ++ Go M W ||T F B F C F S M C || Go 2 F C M E M E M S M V S++ Go F R M B M K M M || F C F H M C M H M M M P M S ||S Gro Lis 1 F L F T M B M B M F M L M R M R M S M++ Fin Wat M B M C M P M R M S || Rea F D F M M A M A M B M C M D M E M H M R M R M S M S M S || Fin Rea Wat 0 M A M A M D M L M M M N M P M R M R M S M V ++M Fin Wat F H M B S|| Loo Loo Rea F R M B || Lea Mak Tal -1 F N M L ++ Wat M J M L ||S M S T|| Loo Wat Wat -2 ++ || Fin Wat ||T -3 ++ <less>||<rare> |
Left-hand column locates the person labels according to ability measures along the latent variable.
Right-hand column locates the item labels by their easiness measures along the latent variable. These are the difficulty measures reversed around the mean person difficulty "M" . The item labels are abbreviated to fit on one page. Table 12.12 has the full item labels.
|
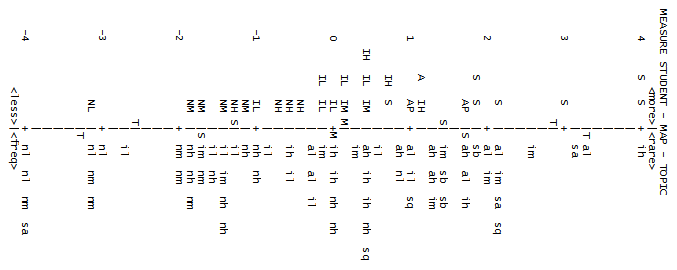
Table 1.11 Wright map - person and item (by easiness) distributions
MEASURE || MEASURE <more> --------------------- KID -++- TAP ----------------- <freq> 5 ++ XXX 5 || X 4 T++ XX 4 XX ||S XX 3 X ++ 3 || X 2 XXXX S++ 2 || X 1 XXXXX ++ 1 || 0 M++M 0 XXXXXXXXXXXX || -1 ++ X -1 XXX || -2 XX S++ XX -2 || -3 XX ++ -3 XX ||S X -4 T++ -4 X || -5 X ++ XXXX -5 <less> --------------------- KID -++- TAP ----------------- <rare>
|
This table shows the distribution of the persons and items. The variable is laid out vertically with the most able persons, and most difficult items at the top.
Left-hand column shows the distribution of person ability measures along the variable.
Right-hand column locates the item labels by their easiness measures along the latent variable. These are the difficulty measures reversed around the mean person difficulty "M" .
|
Table 1.12 Wright map - person distribution + item (by easiness) labels
MEASURE KID - MAP - ACT <more>||<freq> 5 . ++ . || || 4 . ++ . || . T|| 3 . ++ Go on picnic . ||T ## || Go to zoo 2 .## S++ Go to museum ## || .### ||S Grow garden Listen to bird si 1 .#### M++ Find where animal Watch bird make n .## || Read books on ani ####### || Find out what flo Read animal stori Watch birds 0 .##### ++M Find out what ani Watch what animal # S|| Look at pictures Look up strange a Read books on pla # || Learn weed names Make a map Talk w/friends ab -1 # ++ Watch animal move # ||S . T|| Look in sidewalk Watch bugs Watch grass chang -2 ++ || Find bottles and Watch a rat ||T -3 ++ <less>||<rare> EACH "#" IS 2. EACH "." IS 1. |
Left-hand column displays the distribution of person ability measures along the latent variable. The persons often have a normal distribution.
Right-hand column locates the item labels by their easiness measures along the latent variable. These are the difficulty measures reversed around the mean person difficulty "M" . The item labels are abbreviated to fit on one page. Table 12.12 has the full item labels.
|
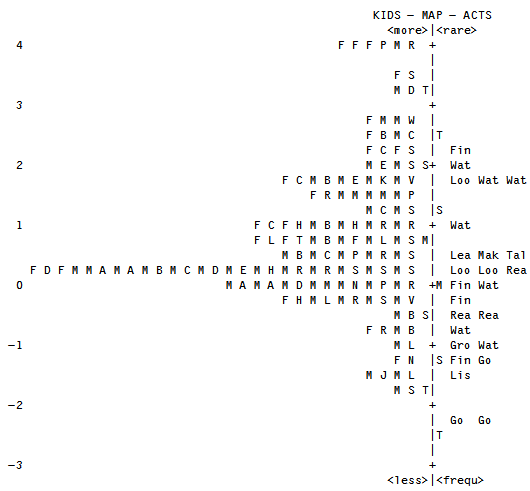
Table 1.13 Wright map - item (by easiness) distribution + person labels
MEASURE TAP - MAP - KID <freq>||<more> 5 XXX ++ X || 4 XX ++T XX S|| Ric Sus 3 ++ Fra X || 2 ++S Ber Bet Els Tho X || 1 ++ Bri Car Dav Joe Zul || 0 M++M || Ann Aud Bar Dor Jam Kim Lin Mik Ron Tra Wal Wil -1 X ++ || Jan Lis Rod -2 XX ++S Bre Pet || -3 ++ Ada Ric X S|| Bla Mar -4 ++T || Don -5 XXXX ++ Hel <rare>||<less> |
Left-hand column locates the item labels by their easiness measures along the latent variable. These are the difficulty measures reversed around the mean person difficulty "M" .
Right-hand column locates the person ability measures along the variable. The persons often have a normal distribution. The person labels are abbreviated to fit on one page. Table 16 has the full person labels
|
On Plot: |
Description: |
SCORE |
raw score on all active items when T1SCORE=Yes. Includes extreme items when TOTALSCORE=Yes |
MEASURE |
Location of person or item on the unidimensional latent variable, in logits or USCALE= units |
<more> |
higher person "ability" = higher raw score with complete data |
<less> |
lower person "ability" = lower raw score with complete data |
<rare> |
higher item "difficulty" = lower item "easiness" = lower score on the item with complete data: PVALUE= |
<frequ> <frequent> |
lower item "difficulty" = higher item "easiness" = higher score on the item with complete data: PVALUE= |
M |
Mean of person or item distribution |
S |
One "sample is the population" standard deviation from the person or item mean |
T |
Two standard deviations from the person or item mean |
X |
one person or item |
# |
several persons or items, e.g., EACH "#" = 4. The value for # can be changed with T1I#= for items, T1P#= for persons. |
. |
between 1 and (# - 1) persons or items, e.g., if # = 4, then "." = 1 to 3 |
| |
Variable advances. Lines without "|" have the same measure as the nearest "|" above. |
|| |
The double line || indicates the two sides have opposite orientations: person ability and item easiness. The item difficulties are reversed.This is useful if the items and persons are being compared to the responses. |
Example: How can we use a Wright item-person map to investigate a test of multiple-choice (MCQ) items?
Please look at your item map. Rasch item maps show the distribution of the item difficulties in logits (equivalent to item p-values) aligned with the distribution of person abilities in logits (equivalent to raw scores). The easiest items are at the bottom (or left-hand side) of the item map. The hardest items are at the top (or right-hand side) of the item map. The most able students are at the top (or right-hand side) of the item map. The least able students are at the bottom (or left-hand side) of the item map.
1. We should have "content" validity for our items. Please put the content-area into the item label for each item, so that you can see the content-areas on the item map. Do the content areas for the items on the item map match your intention such as the curriculum? For example, are there "geography" items in your item map of "arithmetic" items?
2. We should have "construct" validity for our items. When you look at the ordering (hierarchy) of item difficulties, do their content-areas match your intention? For example, in an item map of "arithmetic" items, we expect to see that the "addition" items are the easiest items at the bottom of the map, and the "division" items are the hardest items at the top of the map, with "subtraction" and "multiplication" generally between "addition" and "division".
3. For most sets of items used in school situations, we want the success of most students to be between about 50% and 90%. This is from about 0 logits on the item map (which is the mean difficulty, average difficulty, of the items) up to about +2 logits on the item map.
If much of the person ability distribution is below 0 logits, then the set of items is too hard. You need some easier items if you want to measure the persons accurately. If much of the person ability distribution is about +2 logits, then the set of items is too easy. You need some harder items if you want to measure the persons accurately.
4. We want all the items to contribute to useful measurement of the persons. If some items on the item map are more than 1 logit below almost all of the persons, then those items may be too easy. If some items on the map are above almost all of the persons, then those items may be too hard. Items that are too easy or too hard do not contribute to useful measurement, and may provoke the students into guessing or carelessness.
5. We want to measure all the students with good precision. For this we need the item difficulties to have a roughly uniform distribution. If there are gaps of more than 0.5 logits in the distribution of item difficulties, then items are needed to fill these gaps. If there are rows on the item maps with many items, then there are many items with the about the same difficulty. These items may be duplicative.
Prettifying the Wright item-person map
Get the map to look how you want on your screen by adjusting font sizes, type faces, MRANGE=, MAXPAGE=, etc., then use your PrintScreen key to make a copy of the screen. Paste into Word, PowerPoint, etc. These Tables can be copied-and-pasted into Excel spreadsheets, and then Excel "Text to columns" used to beautify the output. A more elaborate procedure is at Excel item map. Or get the map to look how you want on your screen by adjusting font sizes, type faces, MRANGE=, MAXPAGE=, etc., then use your PrintScreen key to make a copy of the screen. Paste into Word, PowerPoint, etc.
Winsteps can plot one group of persons on a Wright map. To plot two groups of persons onto one Wright map,
1. Plot one group of persons on the Wright map.
2. Copy the Wright map into a Word document (courier font)
3. Plot the second group of person on the Wright map.
4. Copy the Wright map into a Word document (courier font)
5. Rectangular-copy (alt+mouse) the person distribution of the second group into the Wright map of the first group.