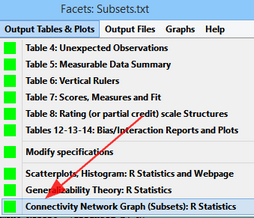
The R Statistics package "igraph" displays the network of connections between elements. This shows the number of connections between pairs of elements and also identifies disconnected subsets of elements. The network is based on Data=. Anchoring, group-anchoring and centering are ignored.
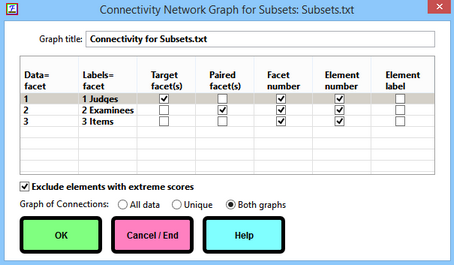
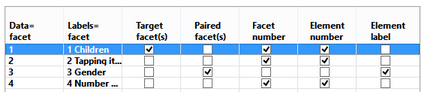
Connectivity Network Dialog Box |
|
Graph title: |
Wording at the top of the graph |
Data= facet |
Column in the data: same as Labels= facet, except when Entry= |
Labels= facet |
Facet number in Labels= |
Target facet(s) |
The facet, or combination facets, with elements at one end of each connection |
Paired facet(s) |
The facet, or combination facets, with elements at the other end of each connection |
Facet number |
Is the facet number to be shown on the graph? |
Element number |
Is the element number to be shown on the graph? |
Element label |
Is the element label to be shown on the graph? |
Exclude elements with extreme scores |
Elements with maximum possible and minimum possible scores are not used for connecting subsets |
Graph of Connections: |
All: all connections between elements in the data Unique: only one connection shown between elements in the data Both Graphs: All and Unique graphs |
OK |
display the "igraph" network graphs |
Cancel/End |
exit |
Help |
this page |
1. Subsets:
Example from subsets.txt
In Table 3: "There are 3 disconnected subsets identified in Table 7."
Click on Target facet: Judges, and Paired facet: Examinees
Click OK
In the Facets analysis window: > R Statistics launched
In the R Statistics Graphics Window, 1-10 is facet 1, element 10.
|
|
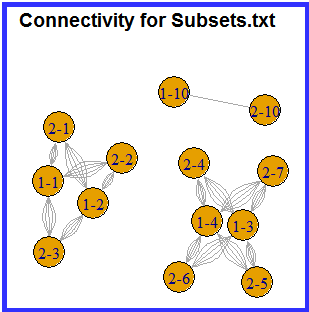
The network graphs shows the 3 subsets, with the elements in each subset identified by "facet number - element number". To resolve the subsetting, group-anchor the elements by subset in one of the facets, or include data that links the subsets. Group-anchoring does not change the network graph, but does resolve the subsetting for estimation purposes.
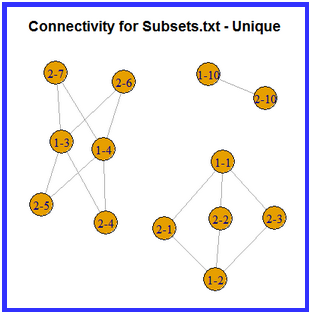
In the "All" graph, the number of lines between elements shows the strength of the connection. In the "Unique" graph, only one connecting line is shown.
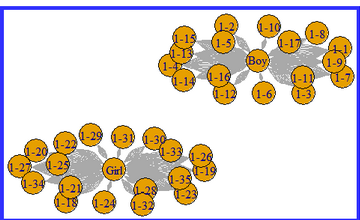
2. Nesting
Some subsets are intended. The connection graph confirms the structure.
Example: kctinter.txt
In Table 3: "Subset connection O.K."
Target facet: Children, Paired facet:Gender with element label
The clusters of Boys and Girls are shown.
3. In R Statistics window
>plot (network)
redraws the network - each redraw looks different - this can improve clarity