Resolving Subsetting problems
Suggestion: eliminate one facet at a time from the analysis. Replace ? by X in Models= to isolate the problem facet.
Solutions: Example: there are 5 tasks but students perform only one.
Facets reports 5 subsets. if an examinee scored high, was it because the examinee was high ability or because the task was easy? To resolve this for your data, we need to constrain the estimates in some way.
1.If your position is that all tasks are equally difficult, then anchor all the tasks at zero.
2.If your position is that the tasks could have different difficulty, but the examinees were assigned to them at random, then the mean ability of the examinees for each task is expected to be about the same, so group-anchor the examinees by task at zero.
3.Other approaches include content experts choosing an examinee from each task group as a standard examinee, then anchoring all the standard examinees at zero.
Some analysts try two or mere approaches, to see which make the most sense of the output.
1. Be sure that your measurement model is unambiguous:
Unambiguous: John Student + Item 1 -> Data
Facets can estimate a unique ability for John and a difficulty for Item 1.
Ambiguous: John Student + Male gender + Item 1 -> Data
Facets can estimate a difficulty for Item 1, but does not know how to split "ability" between "John Student" and "Male gender". Possible actions:
a.) If male gender is only for computing bias/interactions or for obtaining summary fit statistics for the males, then make Gender a Dummy (Demographic) Facet:
Labels=
....
*
2, Gender, D
1 = Female gender
2= Male gender
*
b) If male gender is only for obtaining a sub-total of the male abilities, then
i) specify a "male" group number for all the John Student and all the other male students.
or ii) output the student measures to Excel, and sub-total there.
For the S.E. of the mean: compute the S.E. of the mean of the measures for each subtotal as though they are point estimates (no measurement error). Square this value to give the variance of the mean. Then take the S.E. of each measure in a subtotal, square it to give the error variance of each measure, then average the error variances for the measures in a subtotal. Add this average variance to the variance of the mean, then square-root to give the S.E. of the mean of sub-total measures with measurement error.
c) If a Gender effect must be estimated, then group-anchor the student elements by gender at zero.
2. The data are too thin, too sparse or other problems with the data collection.
There may be subsets because the combination of elements needed to make a fully connected design did not happen. We can make a reasonable guess about what the missing data would be. Then, impute hypothetical data.
Example: in an observational study, some combinations of conditions did not occur. The results was disconnected subsets of data.
Remedy: impute observations for all combinations of conditions, but give them very small weights:
Data=
R0.01 (elements) (hypothetical observation)
Judging Plan (Experimental Designs)
A continuing practical problem in rating performances is eliminating ambiguity introduced by deficient judging plans. These plans are called "non-linked assessment networks" by George Engelhard, Jr. (Constructing rater and task banks for performance assessments. Journal of Outcome Measurement, 1997, 1(1), 19-33). They have a lack of identifiability to produce a unique set of estimates.
In general, a sufficient condition for uniqueness is that the response strings for every pair of persons (A,B,) (and pair of items and pair of ..) contains at least one response where A is higher than B and at least one response where B is higher than A responding to the same pair of items (and tasks and ...), either directly or indirectly through the response strings of their pairings with other persons (items, ...). Also for Andrich polytomies, a similar direct or indirect overlap exists across the higher-lower categories of each rating scale in the response string of a person, (item, ...).
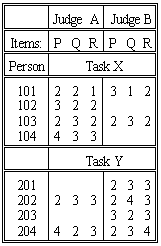
Consider the data shown in the Table. At first glance, all seems well. The three items, P, Q, R, can be in one frame of reference, because they share the same judge-person-task combinations. The two judges, A, B, can be in the same frame of reference, because they rate every second person together. Now comes the problem. The persons seem to share the same frame of reference because so many of them are rated on the same tasks. But there are two tasks. Why are the four 100-group people rated lower on Task X than the four 200-group people on Task Y? Are the 100-group people less able than the 200-group? Is Task X is harder than Task Y? These data cannot say which!
Resolving this ambiguity requires perception and decision. There is a worked example at Subset Reconnection. The first step is to notice the problem. This requires Subset=Yes, the default. If you detect it during data collection, a slight change to the judging plan can remedy the situation. For instance, some people could be asked to perform both tasks. Nevertheless, continue to be on the look out for this ambiguity during analysis.
"Complete data" such as when every judge rates every person on every item is almost always connected. Lack of connectedness is usually a result of the accidental or deliberate manner in which the data was collected, e.g., the judging plan.
Two elements are connected if there exist connections through
either i) patterns of non-extreme high ratings
and ii) patterns of non-extreme low ratings
or iii) constraints, such as anchor values.
Facets examines the data for connectedness using a much enhanced version of a joining algorithm described in Weeks D.L. and Williams D.R., 1964, A note on the determination of connectedness in an N-way cross classification. Technometrics, 6/3, 319-324.
There are exotic forms of connectedness which Facets may falsely report as disconnected. Please alert us if this happens in a practical situation.
See also: G.H. Fischer (1981), On the existence and uniqueness of maximum-likelihood estimates in the Rasch model. Psychometrika 46, pp. 59–77
What lack of connectedness (subsetting) implies:
Beware! Lack of connectedness (= subsets) means that Facets output is ambiguous, perhaps even misleading.
(a) "Disconnection" has no effect on standard errors and fit statistics, nor the measures of elements within facets that are completely connected, such as the items of a test where everyone takes every item.
(b) Disconnection has no effect on relative measures within subsets of elements that are connected. For instance, under the usual "nested" judging plans, the item facet is centered on zero, and all items are connected, so the disconnected subsets of judges would have no effect on the item facet at all.
(c) The only effect of "disconnection" is on the relationship between measures in different subsets. Under these circumstances, Facets reports one of the infinite number of different possible solutions, all equally likely.
Only measures in the same subset are directly comparable. A separate set of vertical rulers is produced for each disjoint subset. These help you identify causes and remedies. See the example data analysis.
When a lack of connectivity is discovered, Facets reports subsets of connected elements:
----------------------------------------------------------------------------------
|Obsvd Obsvd Obsvd Fair | Calib Model | Infit Outfit | |
|Score Count Average Avrge | Logit Error | MnSq Zstd MnSq Zstd | Nu student |
----------------------------------------------------------------------------------
| 16 10 1.6 1.5 | 0.09 0.64 | 0.8 0 0.8 0 | 1 1 | in subset: 1
| 11 10 1.1 1.0 | -2.25 0.85 | 0.5 0 0.4 -1 | 2 2 | in subset: 1
| 16 10 1.6 1.3 | -0.45 0.64 | 0.9 0 0.8 0 | 11 11 | in subset: 2
| 8 10 0.8 0.9 | -3.67 0.76 | 0.8 0 0.6 0 | 12 12 | in subset: 2
Students 1 and 2 are connected in subset 1. Students 11 and 12 are connected in subset 2. The relationship between subsets 1 and 2 is ambiguous. This means that all logit values in subset 1 can be increased or decreased by the same amount, relative to subset 2, without altering the fit of the data to the measurement model. Student 1 is 0.09+2.25=2.34 logits more able than student 2, but student 1's relationship to student 11 is not known, and may not be 0.09+0.45=0.54 logits more able.
Assuring data connectedness
1. Before data collection:
a. Map out the judging plan / experimental design. Look for unintended nesting of elements.
b. Make up dummy data to match the design and use Facets to analyze it. You could make every observation a "1" and specify every model as "B2" (two binomial trials) so that Facets thinks that every element is estimable.
2. During data collection:
Start data analysis simultaneously with data collection. If they had done this at the Salt Lake City Winter Olympics, they would have caught the problems when they were still solvable, and have avoided an embarrassing judging scandal.
Connecting final data
Data collection may have already concluded before the first Facets analysis is made. Consequently, when Facets warns you of lack of connectedness, as in this example, there are two choices for resolving the problem. Either the tasks are "said to be alike" or the people are "said to be alike". It is wise to try both options. The subset group-anchor file will assist here.
If Task X and Task Y were intended to have the same difficulty, then anchor them together at the same measure, usually 0. This resolves the ambiguity, and interprets the overall score difference between the 100-group and the 200-group of persons as a difference in ability levels.
On the other hand, you may have intended that the tasks be different by an amount unknown as yet, but have allocated persons to the tasks more or less at random, intending to obtain two randomly equivalent groups. Then a solution is to treat the two groups of persons as though they estimate the same mean ability. Code each person element with a 0 logit ability and a group number. Then specify group-anchoring to set the mean ability level of the 100-group at the same value as the mean ability level of the 200-group. Now the overall score difference between the 100-group and the 200-group will express a difference in difficulty between Task X and Task Y
 .
.
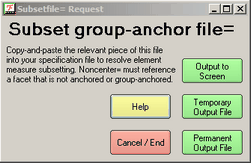
This dialog box, called from the Output Files menu, provides pre-linked elements which can be edited in to your specification file to assist with establishing connections:
Copy-and-paste the relevant sections of this into your specification file to resolve subset problems
Non-center= must reference a facet that is not anchored or group-anchored.
1,Senior scientists, G ; group-anchoring at Umean = 50
1,Avogadro,50, 1
2,Brahe,50, 1
3,Cavendish,50, 2
4,Davey,50, 2
*
2,Junior Scientists, G ; group-anchoring at Umean = 50
1,Anne,50, 1
2,Betty,50, 1
3,Chris,50, 1
4,David,50, 2
5,Edward,50, 2
6,Fred,50, 2
7,George,50, 2
*
Connecting intermediate data
Whenever possible, Facets should be run on available data even before data collection has concluded. Then elements identified as disconnected can be targeted for inclusion in the rating process. Thus, if it is discovered that one panel of judges has been rating the boys and another panel the girls, then some judges can be switched between panels, or some boys rated by the "girls" panel and some girls by the "boys" panel. In the example, some of these examinees, or other students like these examinees, could perform both Task X and Task Y. This would establish the relative difficulty of the tasks.
Double subsetting
Here is an example where elements are reported to be in two subsets. What has happened?
Table 7.1.1 Examinees Measurement Report
|- +---------------------|
| | 1 Mary | in subset: 1 4
| | 2 George | in subset: 2 3
|- +---------------------|
Table 7.2.1 Time-Point Measurement Report
|- +---------------------|
| | 1 Before | in subset: 1 2
| | 2 After | in subset: 3 4
|- +---------------------|
Table 7.3.1 Test-Type Measurement Report
|- +---------------------|
| | 1 Paper-and-Pencil | in subset: 1 3
| | 2 Computer-Adaptive | in subset: 2 4
|- +---------------------|
Each Examinee has been tested at two time-points: Before and After.
Each Examinee has been tested using two test formats, a different one at each time-point: Paper-and-Pencil and Computer-Adaptive.
Subset 1 are all examinees tested "Before" with "Paper-and-Pencil"
Subset 2 are all examinees tested "Before" with "Computer-Adaptive"
Subset 3 are all examinees tested "After" with "Paper-and-Pencil"
Subset 4 are all examinees tested "After" with "Computer-Adaptive"
Mary was a member of the group of examinees that were tested "Before" with "Paper-and-Pencil" then "After" with "Computer-Adaptive".
George was a member of the group of examinees that were tested "Before" with "Computer-Adaptive" then "After" with "Paper-and-Pencil".
Since the two groups of examinees (1,4 and 2,3) were probably assigned at random, we can use group-anchoring to make them randomly equivalent. Let's call the two groups 14 and 23.
Labels=
1, Examinees, G ; group-anchor the examinees
1 = Mary, 0, 14 ; Mary's group is group-anchored at 0
2 = George, 0, 23 ; George's group is group-anchored at 0
....
*
Since, in this example, we imagine that the examinees were assigned at random to their subset, we can use group anchoring to make the connections.
Mathematics: connectivity is part of Graph Theory. The person/item/judge/... parameters of the Rasch model are the vertices and the observations are the edges. In an undirected graph, we need every vertex to be connected directly or indirectly to every other vertex. A connection is established between two vertices when one vertex is observed to have both a higher observation and a lower observation than another vertex in the same context, or when both both vertices have the same intermediate category of a rating scale in the same context.
Thus there are two situation for failure to connect:
1) there is no direct or indirect link between two vertices, e.g., two different datasets analyzed together with no common parameters. This is detected by the Winsteps/Facets subset routine.
2) the vertices are connected by observations, but the observations do not meet the requirements, e.g., all the person respond to all the items, but half the persons score in the upper half of the rating scale on every item, and the other half of the persons score in the lower half of the rating scale on every item. This is called a "Guttman split" in the data. This is usually obvious in the reported estimates as a big gap on the Wright maps between the two halves of the person distribution.
