From the Graphs menu,
Original and Standard Graph Windows |
Enhanced Graph Window |
|
|
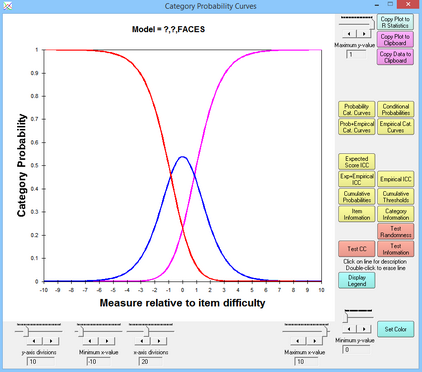
Category Probability Curves: (Probability Cat. Curves) model-based probability of observing each category of the response structure at each point on the latent variable (relative to the item difficulty)
Empirical Category Curves: (Empirical Cat. Curves) data-based relative frequencies of categories in each interval along the latent variable
Category Model and Empirical Curves: (Prob.+Empirical Cat. Curves) the model-based and data-based frequencies of each category.
Expected Score ICC shows the model-based Item Characteristic Curve (or Item Response Function IRF) for the response structure.
Empirical ICC shows the data-based empirical curve.
Cumulative Probabilities plot the model-based sum of category probabilities. The category median boundaries are the points at which the probability is .5. Click on a line to obtain the category accumulation.
Conditional Probability Curves show the model-based relationship between probabilities of adjacent categories. These follow dichotomous logistic ogives. Click on a line to obtain the category pairing.
Item Information Function plots the model-based Fisher statistical information for the item. This is also the model variance of the responses, see RSA p. 100.
Category Information plots the model-based item information partitioned according to the probability of observing the category. Click on a line to obtain the category number.
Test Information Function - this can be plotted with Excel.
Button or Slider |
Function: for complete description, see Winsteps Graph Window |
Adjust maximum Y-value |
Sets the maximum value on the vertical Y-axis |
Adjust Y-axis divisions |
Sets the number of tick-marks on the Y-axis |
Copy Plot to Clipboard |
Copies the graph to the Windows clipboard. This only copies the part of the plot that is visible on your screen. Maximize the chart window and increase your screen resolution if the entire plot is not visible. To increase screen resolution: Windows "Start", "Settings", "Control Panel", "Display", "Settings" and move the "Screen resolution" slider to the right. Open a graphics program, such as Paint, and paste in the image for editing. |
Copy Data to Clipboard |
Copies the graphed numbers to the Windows clipboard (for pasting into Excel, etc.) Use paste special to paste as a picture meta-file, bitmap or as a text listing of the data points. Each row corresponds to a set of points to plot: Column A - ignore (internal row identifier) Column B - x-axis for point on first curve: measure relative to item difficulty or relative to latent variable Column C - y-axis for point on first curve: probability, expected score, etc. Column D - x-axis for point on second curve: measure relative to item difficulty or relative to latent variable Column E - y-axis for point on second curve: probability, expected score, etc. etc. Scatterplot: Column C (y-axis) against Column B (x-axis) Column E (y-axis) against Column D (x-axis) etc. Combined plots: the curves on two or more Facets graphs can be combined into one Excel plot using "Copy Data" from the different graphs into one Excel worksheet. |
Next Curve |
Displays the same graph for the element with the next higher entry number is "#" is specified in the Models= specification or there are multiple Models= specifications. |
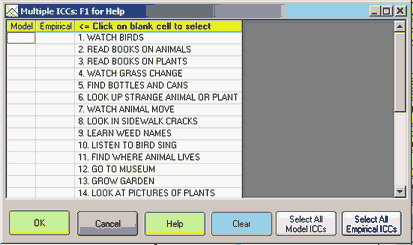
Select Curves |
Displays the graph for the selected item from the curve-selection-box: |
Previous Curve |
Displays the same graph for the item with the next lower entry number. |
Probability Cat. Curves |
Displays the Rasch-model probability-curve for each response-category |
Prob+Empirical Cat. Curves |
Displays the Rasch-model probability-curve for each response-category, together with the empirical curve summarizing the data in each empirical interval. |
Displays the empirical curve for each response-category, summarizing the data in each empirical interval |
|
Prob+Empircal Option Curves |
Displays the Rasch-model probability-curve for each response-option, together with the empirical curve summarizing the data in each empirical interval. |
Empirical Option-Curves |
Displays the empirical curve for each response-option, summarizing the data in each empirical interval |
Displays the expected-score item characteristic curve, the item's Rasch-model logistic ogive. |
|
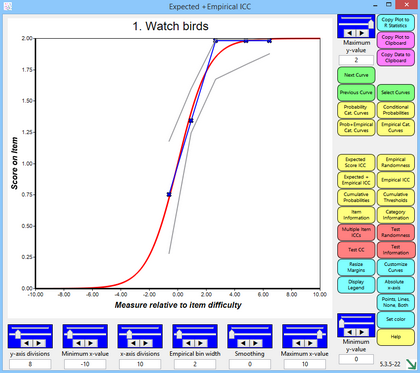
Exp+Empirical ICC |
Displays the expected-score item characteristic curve, the item's Rasch-model logistic ogive, together with the empirical ICC summarizing the data in each empirical interval. |
Displays the item's empirical item characteristic curve, summarizing the data in each empirical interval. |
|
Displays the Rasch-model cumulative probability-curve for each response-category and the categories below it. |
|
Displays the Rasch-model probability-curve for the relative probability of each adjacent pair of categories. These are dichotomous ogives. |
|
Displays the item-information function according to the Rasch model. |
|
Displays the information function for each category according to the Rasch model. |
|
Displays the test-information function according to the Rasch model. The inverse square-root of the test information is the standard error of the Rasch person measure. |
|
Original/Standard: Click on line for description |
Click on a curve to show its description below the graph. You can identify an individual traceline by single-left-clicking on it. Its description will then appear below the plot. Click elsewhere on the plot to remove the selection indicators. |
Original/Standard: Double-click to erase line |
You can remove a traceline by double-left-clicking on it. Click on the command button, e.g., "Probability Curves", to return the plot to its initial appearance. |
Enhanced: Resize Margins |
Adjust the left-margin width and the Legend box height below the graph |
Enhanced: Customize Curves |
Hide unwanted curves and change curve colors |
Display Legend Hide Legend |
Click on "Display legend" to show descriptions of all the curves below the graph. Click on "Hide legend" to remove the descriptions. |
Absolute x-axis Relative x-axis |
Click on "Absolute x-axis" to show the graphs with measures on the latent variable along the x-axis. Click on "Relative x-axis" to show the graphs with the x-axis plotted relative to the item difficulty. |
Click on this button to show the empirical curves as both points("x") and lines, points only, lines only, and neither points nor lines. |
|
Adjust minimum Y-value |
Sets the minimum value on the vertical Y-axis |
Smoothing |
Controls the degrees of smoothing of the empirical curve |
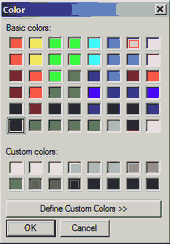
Set Color |
Click on a curve to select it, the click on "Set Color" to change its color using the color-selection-box. |
Help |
Click on Help to display this page. |
Adjust minimum X-value |
Sets the minimum value on the horizontal X-axis |
Fine-tune minimum X-value |
Makes small changes to the minimum value on the horizontal X-axis |
Adjust X-axis divisions |
Sets the number of tick-marks on the X-axis |
Empirical divisions (slider) |
Sets the number of empirical summary-intervals on the X-axis |
Empirical divisions (arrows) |
Makes small changes to the number of empirical summary-intervals on the X-axis |
Fine-tune maximum X-value |
Makes small changes to the maximum value on the horizontal X-axis |
Adjust maximum X-value |
Sets the maximum value on the horizontal X-axis |
Curve selection Box |
|
||
ICC Selection Box |
|
||
Color Selection Box |
|

The probability curves will display. Graphs are plotted relative to the central difficulty of each item or scale group.
The buttons are:
Copy Plot to Clipboard places this plot on the clipboard as a graphic. Open a graphics program, such as Paint, and paste in the image for editing, or paste directly into a Word document.
Copy Plot Data to Clipboard places the plotted data on the clipboard. This can be pasted into an Excel worksheet so that you can use it to construct your own graphs.
Next Curve takes you to the curves for the next Group.
Previous Curve takes you to the curves for the previous Group.
Select Curves enables you to jump to the set of curves you want to see by clicking on the list that is displayed. Click on the desired curve.
Probability Cat. Curves plots the category probability curves according to the model. There is one curve for each category. They sum vertically to 1.0. Click on a line to obtain the category.
Empirical Cat. Curves plot the empirical category frequency points according to the data. The points are joined by lines for ease of viewing.
Prob.+Empirical Cat. Curves plots both the model and empirical category curves.
Expected Score ICC plots the model-expected item characteristic curve, and the empirical one, shown by X. One curve is shown for each rating (or partial credit) scale.
Empirical ICC shows only the empirical, data-derived, item characteristic curve.
Exp+Empirical ICC plots both the model-expected item characteristic curve, and the empirical, data-derived, curve, together with a confidence band for the empirical around the model curve.
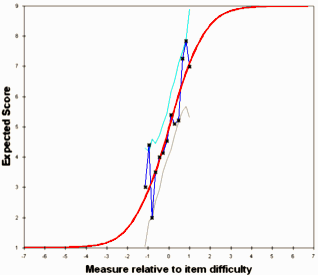
The solid red "model" line is generated by the relevant Rasch model. For a test of dichotomous items, these red curves will be the same for every item with the same rating scale structure. The empirical blue line is constructed from the observed frequencies along the variable, marked by x. The empirical ("x") x- and y-coordinates are the means of the measures and ratings for observations in the interval.
The upper green line (and the lower gray line) are at two model standard errors above (and below) the model "red line", i.e., form a two-sided 95% confidence band. The distance of these lines from the red line is determined by the number of observations in the interval, not by their fit.
Cumulative Probabilities plot the sum of category probabilities. The category median boundaries are the points at which the probability is .5. Click on a line to obtain the category identification.
Conditional Probabilities plots the model ogives for adjacent pairs of categories. Click on a line to obtain the category pairing.
Information Function plots the Fisher statistical information for the item. This is also the model variance of the responses, see RSA p. 100.
Category Information plots the item information partitioned according to the probability of observing the category. Click on a line to obtain the category number.
Display Legend (Hide Legend) displays identification for all lines on the plot
Absolute x-axis displays the curves positioned on the latent variable, rather than relative to the element difficulty. Relative x-axis positions the curves relative to the element difficulty.
Points, Lines, None, Both controls display of the empirical curves.
Smoothing smooths the empirical curves.
Set color changes the color of the currently selected part of the plot.
Help displays this page.
The graphical display is controlled by:
Adjust or fine-tune minimum or maximum enables you to change the x- and y- scale ranges.
Adjust number of divisions enables you to change the number of x- and y- tick marks and labels.
Empirical interval sets the width of the interval on the latent variable summarized by each x on the empirical lines. Displays only when empirical lines are displayed.
On the plot:
Original/Standard: Traceline: You can identify an individual traceline by single-left-clicking on it. Its description will then appear below the plot. Click elsewhere on the plot to remove the selection indicators. You can remove a traceline by double-left-clicking on it. Click on the command button, e.g., "Probability Curves", to return the plot to its initial appearance.
Suggestion: If you need to copy-and-paste several graphs into a document, automate the process with a Windows short-cut macro, such as Autohotkey.
Click on Close Box  in upper right corner to close the Graphs menu.
