Andrich thresholds: disordered thresholds are no problem for the formulation of polytomous Rasch models, nor for estimating Rasch measures, nor do they cause misfit to the Rasch model. They are only a problem if the Andrich thresholds are conceptualized as the category boundaries on the latent variable.
The reason for rescoring disordered thresholds is not to improve data-to-model fit, nor to improve the precision (reliability) of the Rasch measures (rescoring reduces precision). The reason is to simplify inference from the Rasch person measures to the more probable categories of the rating scale.
So, when you explain your rating scale to your audience or use it in a practical situation, will the inferences be better if you rescore all items or apply different rescoring to different items? If every item is designed to use the same rating scale, then your audience will probably be confused about the rating scale if the rating scale is rescored in different ways for different items. Further, rescoring the items in different ways for different items will change the relationship between the original raw scores and the Rasch measures. Some different raw scores as originally scored will have the same measures, and some different measures will have the same original raw scores.
Andrich thresholds (step values) are parameters of the Rasch Rating-Scale and Partial-Credit models. They are the points on the latent variable where adjacent categories of the item are equally probable. Their locations are estimated primarily from the category frequencies. So, if the intermediate category has a relatively high frequency, the thresholds will advance, but if the intermediate category has a relatively low frequency, then the thresholds will be reversed (disordered). This is illustrated in a youtube video. https://www.youtube.com/watch?v=Rs3F7a6I8_0
If you need to interpret the partial-credit rating scale, e.g., 0-1-2, as "a person will go from 0 to 1 to 2 as they advance", then you need the items to have ordered thresholds, but if "a person will go from 0 to 1or2 to 2 as they advance" is good enough, then the threshold ordering does not matter. This is usually the case with partial-credit items. Regardless of the threshold ordering, we need the average ability of the persons who respond in each category to advance. This indicates that the categories represent advancing levels of the latent variable.
Summary: If the average measures for the person sample advance across categories for an item or rating scale, then the categories support the Rasch axiom that: "higher scores on the item <-> higher measures for the sample".
The chief purpose for collapsing categories is to enable inferences to be made at the item-category-level:
"as person measures increase, each category in turn is more probable than any one of the others to be observed".
If you want to make this statement, please collapse categories adjacent to disordered thresholds (and lose some measurement information). Otherwise, not.
"Disordering" is a contentious issue in Rasch analysis. It is often misunderstood by novice analysts, the type of analysts eager to get papers published and their feet firmly on the academic/professional ladder. More experienced analysts would tend to produce more ambivalent findings, suggesting alternate interpretations and actions. This type of finding is less likely to be submitted/accepted for publication because it appears to be wishy-washy. My own recommendation is usually that "threshold disordering" is a minor problem, (only relevant if category-level inferences are to be drawn from the data about individuals,) provided that "category disordering" (disordering of the substantive meanings of the categories) is not observed in the data. Unfortunately novice analysts may confuse "threshold disordering" with "category disordering" and so make incorrect statements about the data and the rating scales that generate it.
In my experience, category disordering is observed when
(1) raters are asked to rate in more categories than they can discriminate, e.g., "on a scale from 0-100, rate the person's cheerfulness".
(2) category definitions are not clearly ordered, e.g.,
1=never, 2=rarely, 3=occasionally, 4=sometimes, 5=often, 6=frequently, 7=always
(3) arbitrary rules distort the rating-scale, e.g., "if the behavior is not observed by the rater or not allowed or not possible, then rate the person 1=never". So that "does the person use the stairs" is rated "1" for all persons in a facility without stairs.
"Threshold disordering" occurs when a category corresponds to a narrow interval of the latent variable, e.g., "almost always" in
1=never, 2=sometimes, 3=often, 4=almost always, 5=always
Here the threshold between categories 3 and 4 will be disordered, even if the raters can clearly discriminate the 5 different levels.
Disordered Andrich thresholds indicate that a category occupies a narrow interval on the latent variable (usually because the category is observed relatively rarely). This is not a problem unless you need advancing abilities to probably increment smoothly up the categories of the rating scale without skipping narrow categories.
If this is a problem for you, then please collapse categories. This usually requires some experimenting to find the best solution:
1) Look at the average measures for each category. Combine categories with disordered average measures
2) Look at the category frequency. Combine categories with low frequencies
Disordered Andrich thresholds indicate that some categories on the latent variable are narrow. Disordered Andrich thresholds do not violate Rasch models, but they may impact our interpretation of how the rating scale functions.
Example: Imagine a location on the latent variable that is the boundary between two categories. If there are exactly 1,000 people with measures at that boundary. We would expect to observe 500 of them in categories below the boundary and 500 of them in categories above the boundary. Dichotomous items function exactly this way.
dichotomous item 0-1 |
|
category 0 on latent variable |
category 1 on latent variable |
1000 persons here → |
|
500 persons observed here as 0 |
500 persons observed here as 1 |
dichotomous item difficulty → |
|
Polytomous items (RSM, PCM) are move complex. RSM and PCM predict that some of the 1000 will be observed in categories next to the boundary, and some in categories further away, so that there will be 500 in total above the boundary and 500 below the boundary. OK so far?
polytomous item 0-1-2 (ordered categories, ordered Andrich thresholds) |
||
category 0 |
category 1 (wide) |
category 2 |
1000 persons here → |
← |
|
500 persons observed here as 0 |
490 persons observed here as 1 |
10 persons observed here as 2 |
|← Andrich threshold → | (ordered) |
||
For 3 rating-scale categories 0,1,2 our first boundary is between 0 and 1. If category 1 is very wide, almost all the 500, say 490, will be observed in category 1 and 10 in category 2. The Andrich threshold corresponding to each boundary is basically ln(frequency of category below/frequency of category above), so the Andrich threshold for our first boundary 0-1 is something like ln(500/490) = 0.0 and for the next boundary, 1-2, ln(490/10) = 3.9. The Andrich thresholds are in ascending order.
polytomous item 0-1-2 (ordered categories, disordered Andrich thresholds) |
||
category 0 |
category 1 (narrow) |
category 2 |
1000 persons here → |
← |
|
500 persons observed here as 0 |
10 persons as 1 |
490 persons observed here as 2 |
→ | Andrich threshold |← (disordered) |
||
But if category 1 is very narrow, only 10 of the 500 may be observed in category 1, and 490 in category 2 above the narrow category 1. The Andrich threshold for our first boundary 0-1 is something like ln(500/10) = 3.9 and for the next boundary, 1-2, ln(10/490) = -3.9. So the categories are disordered, even though the data fit the Rasch model perfectly!
Disordered Andrich thresholds indicate narrow categories on the latent variable. Statistically, these are no problem, but for practical purposes we may want all the categories to be wide enough that the Andrich thresholds are ordered.
The category boundaries in this example are reported as the "Rasch-Thurstonian thresholds".
Effect of collapsing categories on measurement
In general, reducing the number of categories tends to improve the fit of the data to the model at the expense of losing some of the statistical information in the ratings. You will probably see the impact of the loss of information in the Person Reliability value.
For instance, if the person reliability drops from 0.9 to 0.8, we can use the Spearman-Brown Prophecy Formula to tell us what the loss of information is equivalent to in terms of items lost. If the original number of items is, say, 10, then reducing the number of categories in the rating scale is equivalent to reducing the number of items to:
Items = 10 * 0.8 * (1-0.9) / ( (1-0.8)*0.9) = 4.4, so items lost = 10 - 4.4 = 5.6
In general, we expect: items lost = (original item count)*(original category count - new category count) / (original category count - 1)
This only matters if the effect of the reduction in categories is to make the Person Reliability too small to discriminate the desired number of ability strata in the target person population. www.rasch.org/rmt/rmt63i.htm
There is considerable debate in the Rasch community about the meaning of rating (or partial credit) scales and polytomies which exhibit "disorder". Look at Table 3.2, distractor/option analysis. Two types of disorder have been noticed:
(i) Disorder in the "average measures" of the categories can imply disorder in the category definitions.
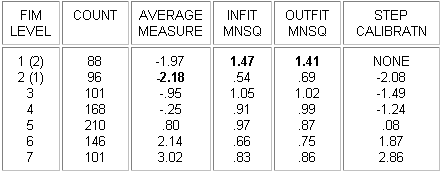
In this example, from Linacre, J.M. (1999) Category Disordering vs. Step Disordering, Rasch Measurement Transactions 13:1 p. 675, "FIMÔ Level" categories have been deliberately disordered in the data. It is seen that this results in disordering of the "average measures" or "observed averages", the average abilities of the people observed in each category, and also large mean-square fit statistics. The "Rasch-Andrich thresholds", also called "step calibrations", "step difficulties", "step measures", "deltas", "taus", etc., remain ordered.
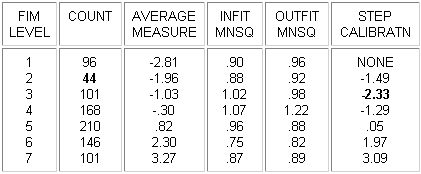
(ii) Disordered Rasch-Andrich thresholds imply less frequently observed intermediate categories, i.e., that they correspond to narrow intervals on the latent variable.
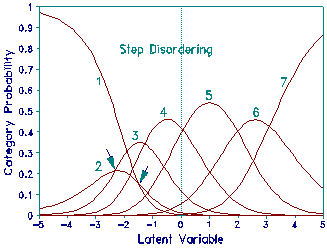
In this example, the FIM categories are correctly ordered, but the frequency of level 2 has been reduced by removing some observations from the data. Average measures and fit statistics remain well behaved. The disordering in the Andrich thresholds now reflects the relative infrequency of category 2. This infrequency is pictured in plot of probability curves which shows that category 2 is never a modal category in these data. The Andrich Threshold values do not indicate whether measurement would be improved by collapsing levels 1 and 2, or collapsing levels 2 and 3, relative to leaving the categories as they stand.
Example: Here are the category probability curves for a Likert rating scale: 1=Strongly disagree, 2=Disagree, 3=Neutral, 4=Agree, 5=Strongly Agree. 3="Neutral" is relatively rarely observed. It has disordered thresholds. The point of equal probability between categories 3 and 4, the Rasch-Andrich threshold for category 4, is less than the point of equal probability between categories 2 and 3, the Rasch-Andrich threshold for category 3.
CATEGORY PROBABILITIES: MODES - Andrich Thresholds at intersections
P -+-----+-----+-----+-----+-----+-----+-----+-----+-----+-----+-
R 1.0 + +
O |111111 5555555|
B | 111 555 |
A | 111 55 |
B .8 + 1 55 +
I | 11 5 |
L | 1 55 |
I | 1 5 |
T .6 + 11 5 +
Y | 1 5 |
.5 + 1 22222 444 5 +
O | 2* 22 44 4* |
F .4 + 22 1 2 4 5 44 +
| 2 1 24 5 4 |
R | 22 1 42 5 44 |
E | 2 1 4 2 5 44 |
S .2 + 22 13*3333*5 44 +
P | 222 33*1 55*33 44 |
O | 222 33344 1 5 2 33 444 |
N |222222 33333444 55*11 22233333 4444444|
S .0 +**********************555555 111111**********************+
E -+-----+-----+-----+-----+-----+-----+-----+-----+-----+-----+-
There are several options:
1.Do not change the rating scale. We do this when recoding the categories in any way would confuse our audience, or the threshold disordering is not important for our inferences. For example: scoring Olympic Ice-Skating in Exam15.txt. This has a very long rating-scale for a small sample of skaters, so that there are many disordered thresholds and unobserved categories.
2.Rewrite the rating scale in the attitude survey without category 3: 1=Strongly disagree, 2=Disagree, 3=Agree, 4=Strongly Agree. This changes the meaning of all the categories, so we must then re-administer the survey.
3.Recode "Neutral" as missing (not administered) data. We do this when we think "Neutral" means "I do not want to tell you what I really think."
4.Recode "Neutral" as "Disagree". We do this when we want to be sure that "Agree" means that respondents truly agree.
5.Recode "Neutral" as "Agree". We do this when we want to be sure that "Disagree" means that respondents truly disagree.
6.Recode "Neutral" as the nearer of "Disagree" and "Agree" according to the empirical data. Please look at the "Observed Average Measures" (OBSVD AVRGE) for each category, and recode "Neutral" accordingly. In this example, Neutral (.12) is nearer to Disagree (-.96) than to Agree (1.60)
---------------------------------------
|CATEGORY OBSERVED|OBSVD | ANDRICH |
|LABEL SCORE COUNT %|AVRGE |THRESHOLD|
|-------------------+-------+---------+
...
| 2 2 453 32| -.96 | -1.37 | 2 Disagree
| 3 3 35 2| .12 | 0.58 | 3 Neutral
| 4 4 537 37| 1.60 | -0.42 | 4 Agree
...
---------------------------------------
