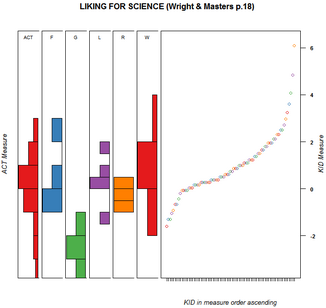
R Statistics WrightMap produced from the Winsteps "Plots" menu using Example0.txt and the default values for the Winsteps-produced WrightMap. WrightMap is courtesy of Torres Irribarra, D. & Freund, R. (2014). Wright Map: IRT item-person map with ConQuest integration. Available at https://github.com/david-ti/wrightmap.
To save plot to Desktop, right-click on plot or, at the R Statistics prompt, > dev.print(pdf, 'filename.pdf')
With the Winsteps WrightMap interface, no knowledge or R action is required. The WrightMap is produced like this:
1.Install R Statistics (once only)
2.Launch Winsteps
3.Do an analysis
4.Winsteps Plots menu, "Wright Map"
5.Let's go with the defaults: click on "WrightMap (Save)" - One Click!
6.R Statistics launches automatically. (No action needed by you.)
7. WrightMap displays. (No action needed by you.)
8.To save the WrightMap to your Desktop, right-click on it, or at the R Statistics prompt, > dev.print(pdf, 'filename.pdf')
9.When finished with R: click on the R-window top-right close box.
Notes:
1.You can have several plots open at once. Each has a new instance of R.
2.Andrich thresholds: they are shown at their numerical value, whatever their ordering, except for thresholds for unobserved categories. These should be at infinity, but are shown at the item difficulty.
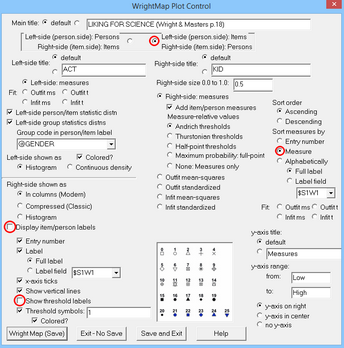
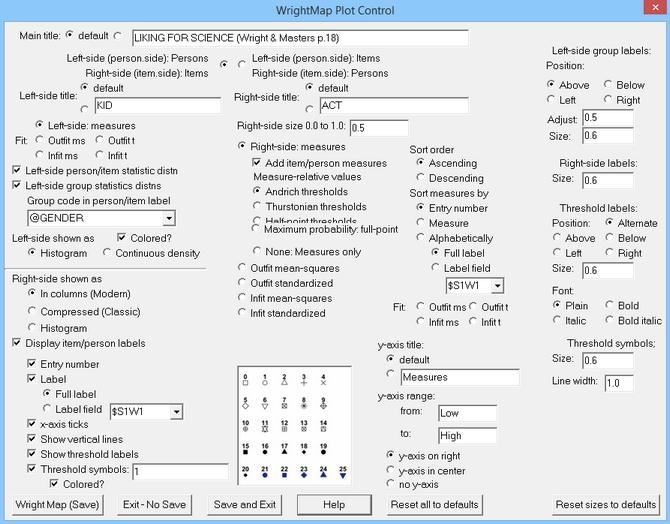
WrightMap Plot Control |
WrightMap command - see |
Purpose |
Top: |
||
Main title |
main.title = |
Main title at the top of the Wright Map Default: TITLE= |
Left-side (person.side) Persons Right-side (item.side) Items |
wrightMap (thetas, thresholds, |
Person distributions on left side. Item columns on right side of Wright Map |
Left-side (person.side) Items Right-side (item.side) Persons |
wrightMap (thresholds, thetas, |
Item distributions on left side. Person columns on right side of Wright Map |
1st Column: |
person.side |
Left-side of Wright Map |
Left-side title |
axis.persons = |
Subtitle for left side |
Left-side: measures |
the histograms on the left-side are of measures. |
|
Fit: Outfit mean-square Outfit standardized Infit mean-squares Infit standardized |
the histograms on the left-side are of fit statistics |
|
Left-side person/item statistic distn |
first column of thetas/thresholds |
Are the all the person/items the first distribution on the left side |
Left-side group statistic distns |
more columns of thetas/thresholds |
Are there distributions on the left side for person/item groups |
Group code in person/item labels |
dim.names = |
Codes in person/item labels identifying person/item groups |
Colored? |
dim.color = |
Are the person/item distributions colored? |
Left-side shown as: Histogram |
person.side = personHist |
Show person/item distributions as historgrams. Distributions with only one person/item are increased to two for display purposes only. |
Continuous density |
person.side = personDens |
Show person/item distributions as smoothed curves. Distributions with only one person/item are increased to two for display purposes only. |
1st Column: |
item.side |
Right-side of Wright Map |
Right-side shown as In columns (Modern) |
item.side = itemModern |
each item/person has a column |
Compressed (Classic) |
item.side = itemClassic |
items/persons compressed into one column |
Histogram |
item.side = itemHist |
items/persons shown as a histogram |
Display item/person labels |
label.items= |
item/person labels displayed below columns |
Entry number |
include item/person entry number in column label |
|
Label |
include item/person label in column label |
|
Full label |
include as much of item/person label as possible |
|
Label field |
include this part of item/person label |
|
x-axis ticks |
label.items.ticks = |
show a tick on the x-axis for each item/person |
Show vertical lines |
vertLines = |
connect plotted threshold values with a faint line for eahc item/person |
Show threshold labels |
show.thr.lab = |
label the item/person thresholds with their threshold numbers |
Threshold symbols: |
show.thr.sym= |
mark the item/persons threshold with symbols |
(symbol box) |
thr.sym.pch = |
symbol(s) to use. Available symbols, 1-25, are shown. For instance, 3, 4 |
Colored? |
thr.sym.col.fg= thr.lab.col= |
threshold labels and symbols are colored |
2nd Column: |
item.side |
Right-side of Wright Map |
Right-side title |
axis.items = |
Subtitle for right side |
Right-side size 0.0 to 1.0 |
item.prop = |
right-side proportion of the whole plot |
Right-side measures |
the display on the right-side is of measures |
|
Add item/person measures |
thresholds |
item/person measures are added to the threshold values |
Measure-relative values Andrich thresholds |
thresholds |
threshold values are Andrich thresholds relative to item/person measures |
Thurstonian thresholds |
thresholds |
threshold values are Thurstonian thresholds relative to item/person measures |
Half-point thresholds |
thresholds |
threshold values are Half-point thresholds relative to item/person measures |
Maximum probability full-point |
thresholds |
threshold values are points of maximum probability for the categories relative to item/person measures, where observed score on the item = the expected score, corrected for extreme categories |
None: Measures only |
thresholds |
threshold values are not added to the item/person measures |
Outfit mean-square Outfit standardized Infit mean-squares Infit standardized |
the display on the right-side is of fit statistics |
|
(symbol box) |
thr.sym.pch = |
symbol(s) to use. Available symbols, 1-25, are shown. For instance, 3, 4 |
3rd Column: |
item.side |
Right-side of Wright Map |
Sort order: Ascending Descening |
thresholds |
order of item/person columns |
Sort measures by Entry number Measure Alphabetically Fit: Outfit mean-square Outfit standardized Infit mean-squares Infit standardized |
thresholds |
values to use when ordering the item/person columns. Alphabetically: see right-side Label
|
y-axis label |
axis.logits = |
Title of y-axis, such as "Logits" |
y-axis range from: (Low) to: (High) |
min.l= max.l= |
Sets the extremes of the y-axis. Blank or non-numeric for the default values |
y-axis on right, y-axis in center, no y-axis |
show.axis.logits = "L", "R" or "N" |
placement of y-axis on plot |
4th Column: |
person.side |
Left-side of Wright Map |
Left-side group (dimension) labels position: Above, Below, Left, Right |
dim.lab.side = |
Placement of the labels for the left-side histograms |
Left-side group (dimension) labels Adjust 0.0 to 1.0 |
dim.lab.adj = |
Adjust position of labels for the left-side histograms: 0.5 = middle position, 0.0 = left position, 1.0 = right position |
Left-side group (dimension) labels Size 0.1 upwards |
dim.lab.cex = |
Font size of labels for left-side histograms. 0.6 is the default. |
4th Column: |
item.side |
Right-side of Wright Map |
Right-side column labels Size 0.1 upwards |
label.items.cex = |
Font size of labels for right-side histograms. 0.6 is the default. |
Threshold label position: Alternate, Above, Below, Left, Right |
thr.lab.pos = |
Placement of the labels for the right-side thresholds |
Threshold labels Size 0.1 upwards |
thr.lab.cex = |
Font size of labels for thresholds. 0.6 is the default. |
Threshold labels Font: Plain, Bold, Italic, Bold Italic |
thr.lab.font = |
Font style of labels for thresholds. Plain is the default. |
Threshold symbols Size 0.1 upwards |
thr.sym.cex = |
Font size of symbols for thresholds. 0.6 is the default. |
Vertical lines between thresholds Width |
thr.sym.lwd = |
Width of vertical light-grey lines between thresholds. |
Push buttons: |
||
Wright Map (Save) |
wrightMap(....)
To save the displayed plot, right-click in the plot window. |
launches R Statistics WrightMap function and saves the settings in the Dialog box. |
Exit-No Save |
Closes the Dialog Box without saving any changed settings since the last Wright Map output |
|
Save and Exit |
Saves the settings and closes the Dialog Box. |
|
Help |
Displays this page |
|
Reset to defaults |
Sets all WrightMap settings to their default values |
|
Reset sizes to defaults |
Sets sizes of fonts, symbols and lines to their default values |
Notes:
1. WrightMap requires that R Statistics is installed: cran.rstudio.com/bin/windows/base/
2. The WrightMap will be slow to display the first time because the required R Statistics packages will be installed automatically. WrightMaps are never fast to display.
3. If your WrightMap appears wrong, please allow Winsteps to install the most recent relevant version of the WrightMap package. In your R window:
> remove.packages("WrightMap")
then the correct package will be installed automatically by Winsteps when you launch the next WrightMap.
5. After viewing the WrightMap, you can use all the R Statistics functions, or close the R windows. Respond "No" if there is a "Save workspace" message.
6. To change the titles, etc.
Make the plot in R, then do > ls() to see where all the labels etc. are stored:
> ls()
[1] "colors" "dimnames" "labels" "q" "quit"
[6] "thetas" "thresh" "threshlabels" "titles" "zero"
for the item labels:
> labels
[1] "1. Watch" "2. Read b" "3. Read b" "4. Watch" "5. Find b" "6. Look u"
[7] "7. Watch" "8. Look i" "9. Learn" "10. Liste" "11. Find" "12. Go to"
[13] "13. Grow" "14. Look" "15. Read" "16. Make" "17. Watch" "18. Go on"
[19] "19. Go to" "20. Watch" "21. Watch" "22. Find" "23. Watch" "24. Find"
[25] "25. Talk"
> labels <- c("label1", "label2", ........, "labelast")
You may want to remove the x-axis label:
> titles
TITLES
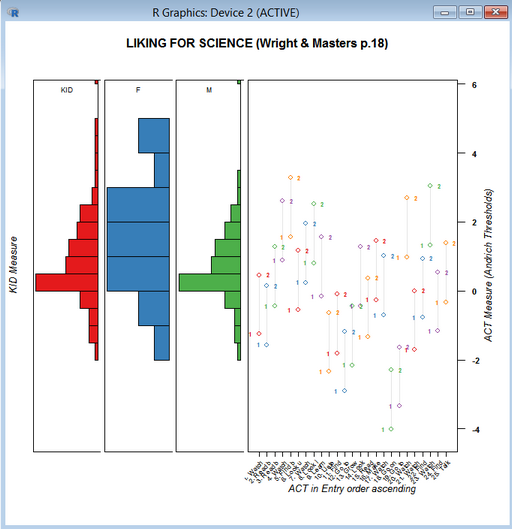
1 LIKING FOR SCIENCE (Wright & Masters p.18)
2 KID Measure
3 ACT in Entry order ascending <- this will overlay longer labels
4 ACT Measure (Andrich Thresholds)
You can change the left-hand column headings "dimnames"
dimnames <- c("heading 1", "heading 2", "heading 3")
Then copy the very long line on the R screen starting "wrightMap ...."
and paste it at the >
to make the plot again
Example 2: WrightMap of groups of item difficulties with person measures ascending.
|
|