Cluster Measure Plot - Table 23.6

From the Plots menu, Cluster Measure Plot produces the plotted output corresponding to Table 23.6. It shows the person measures for each cluster of items (perhaps belonging to different dimensions) in Table 23.1.


From the Output Tables or the Plots menu, these dialogs are displayed:


Choose PRCOMP= option, and whether to output Table 23 and/or the Excel plot of Table 23.6


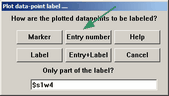
When the Excel plot is chosen, then select what data point labels are is to be displayed on the Excel plot. In this case, the person entry number.


Here is Table 23.1

3 clusters of items are identified vertically. The items at the top contrast in some way with the items at the bottom. They could be on different dimensions or strands or item formats or ....

Here is Table 23.6

This reports the measures for each person on each cluster of items. If the clusters are different dimensions, then we expect the person measures to be considerably different for the different clusters.

TABLE 23.6 LIKING FOR SCIENCE (Wright & Masters  ZOU550WS.TXT  Apr  1 2015 10:55            

INPUT: 79 KID  25 ACT  REPORTED: 77 KID  25 ACT  6 CATS          WINSTEPS 3.90.0            

--------------------------------------------------------------------------------            


---------------------------------------------------------------------------------------------

|                         CONTRAST 1  CLUSTER MEASURES                                      |

|                 |   CLUSTER 1   |   CLUSTER 2   |   CLUSTER 3   |                         |

|     KID  STATUS | MEASURE  S.E. | MEASURE  S.E. | MEASURE  S.E. | KID LABEL               |

|-----------------+---------------+---------------+---------------+-------------------------|

|       5     1   |     .48   .71 |     .00   .63 |    1.09   .59 | M Rossner, Marc Daniel  |

|       6     1   |    1.35   .63 |     .77   .62 |    1.14   .58 | M Rossner, Toby G.      |

|       7     1   |     .48   .71 |     .38   .62 |     .07   .47 | M Rossner, Michael T.   |

|       8     1   |     .94   .66 |    -.87   .71 |   -1.15   .45 | F Rossner, Rebecca A.   |

Here is the Excel plot for Clusters 1 and 2.

The person measures, estimated for each cluster of item, are cross-plotted. 95% Confidence Bands are drawn based on the S.E.s of the measures. The confidence bands are averaged across the persons.The diagonal line on the plot is the identity line. All the points in the plot would fall on this line if the person measures on both clusters were the same.


If almost all the points are within the confidence bands, then the two clusters of items are not measuring the persons in a statistically different way. However, individual persons outside the confidence bands do have statistically different performance levels on the clusters.


Each plotted point has its own confidence interval. These are in the Worksheet Column (U,V) and (W,X). Excel plots smooth curves (trend lines) through the end-points of all these intervals using quadratic (2) polynomials. Please right click on the curves to change the polynomials. For some plots, quartic (4) polynomials may be better.

Here is the Excel plot for Clusters 1 and 3.

The items in Clusters 1 and 3 are the most different, so we expect that their person measures will also be the most different. Here we see more persons outside the confidence bands, but also many within.


In this plot, the persons in the orange box have maximum scores on the items in Cluster 3, but different score on the items in Cluster 1.


Cluster Measure Worksheet

Columns A-I correspond to Table 23.6.

Columns J-X are for drawing the confidence bands. For the formulas for these columns, see Scatterplot.

Trend Lines

The dotted diagonal line is the identity line. The points would lie on this line if the person measures were the same for both sets of items.

The curved lines are 95% two-sided confidence intervals. Points outside the lines have significantly different measures.

The red line is a trend line showing the relationship between the two sets of person measures. This line goes through a point defined by the means of the two sets of person measures. The slope of the line is the ratio of the two standard deviations.


Help for Winsteps Rasch Measurement and Rasch Analysis Software: www.winsteps.com. Author: John Michael Linacre

Facets Rasch measurement software. Buy for $149. & site licenses. Freeware student/evaluation Minifac download
Winsteps Rasch measurement software. Buy for $149. & site licenses. Freeware student/evaluation Ministep download

Rasch Books and Publications: Winsteps and Facets
Applying the Rasch Model (Winsteps, Facets) 4th Ed., Bond, Yan, Heene Advances in Rasch Analyses in the Human Sciences (Winsteps, Facets) 1st Ed., Boone, Staver Advances in Applications of Rasch Measurement in Science Education, X. Liu & W. J. Boone Rasch Analysis in the Human Sciences (Winsteps) Boone, Staver, Yale Appliquer le modèle de Rasch: Défis et pistes de solution (Winsteps) E. Dionne, S. Béland
Introduction to Many-Facet Rasch Measurement (Facets), Thomas Eckes Rasch Models for Solving Measurement Problems (Facets), George Engelhard, Jr. & Jue Wang Statistical Analyses for Language Testers (Facets), Rita Green Invariant Measurement with Raters and Rating Scales: Rasch Models for Rater-Mediated Assessments (Facets), George Engelhard, Jr. & Stefanie Wind Aplicação do Modelo de Rasch (Português), de Bond, Trevor G., Fox, Christine M
Exploring Rating Scale Functioning for Survey Research (R, Facets), Stefanie Wind Rasch Measurement: Applications, Khine Winsteps Tutorials - free
Facets Tutorials - free
Many-Facet Rasch Measurement (Facets) - free, J.M. Linacre Fairness, Justice and Language Assessment (Winsteps, Facets), McNamara, Knoch, Fan
Other Rasch-Related Resources: Rasch Measurement YouTube Channel
Rasch Measurement Transactions & Rasch Measurement research papers - free An Introduction to the Rasch Model with Examples in R (eRm, etc.), Debelak, Strobl, Zeigenfuse Rasch Measurement Theory Analysis in R, Wind, Hua Applying the Rasch Model in Social Sciences Using R, Lamprianou Journal of Applied Measurement
Rasch Models: Foundations, Recent Developments, and Applications, Fischer & Molenaar Probabilistic Models for Some Intelligence and Attainment Tests, Georg Rasch Rasch Models for Measurement, David Andrich Constructing Measures, Mark Wilson Best Test Design - free, Wright & Stone
Rating Scale Analysis - free, Wright & Masters
Virtual Standard Setting: Setting Cut Scores, Charalambos Kollias Diseño de Mejores Pruebas - free, Spanish Best Test Design A Course in Rasch Measurement Theory, Andrich, Marais Rasch Models in Health, Christensen, Kreiner, Mesba Multivariate and Mixture Distribution Rasch Models, von Davier, Carstensen
As an Amazon Associate I earn from qualifying purchases. This does not change what you pay.

facebook Forum: Rasch Measurement Forum to discuss any Rasch-related topic

To receive News Emails about Winsteps and Facets by subscribing to the Winsteps.com email list,
enter your email address here:

I want to Subscribe: & click below
I want to Unsubscribe: & click below

Please set your SPAM filter to accept emails from Winsteps.com
The Winsteps.com email list is only used to email information about Winsteps, Facets and associated Rasch Measurement activities. Your email address is not shared with third-parties. Every email sent from the list includes the option to unsubscribe.

Questions, Suggestions? Want to update Winsteps or Facets? Please email Mike Linacre, author of Winsteps mike@winsteps.com


State-of-the-art : single-user and site licenses : free student/evaluation versions : download immediately : instructional PDFs : user forum : assistance by email : bugs fixed fast : free update eligibility : backwards compatible : money back if not satisfied
 
Rasch, Winsteps, Facets online Tutorials


Coming Rasch-related Events
May 17 - June 21, 2024, Fri.-Fri. On-line workshop: Rasch Measurement - Core Topics (E. Smith, Winsteps), www.statistics.com
June 12 - 14, 2024, Wed.-Fri. 1st Scandinavian Applied Measurement Conference, Kristianstad University, Kristianstad, Sweden http://www.hkr.se/samc2024
June 21 - July 19, 2024, Fri.-Fri. On-line workshop: Rasch Measurement - Further Topics (E. Smith, Winsteps), www.statistics.com
Aug. 5 - Aug. 6, 2024, Fri.-Fri. 2024 Inaugural Conference of the Society for the Study of Measurement (Berkeley, CA), Call for Proposals
Aug. 9 - Sept. 6, 2024, Fri.-Fri. On-line workshop: Many-Facet Rasch Measurement (E. Smith, Facets), www.statistics.com
Oct. 4 - Nov. 8, 2024, Fri.-Fri. On-line workshop: Rasch Measurement - Core Topics (E. Smith, Winsteps), www.statistics.com
Jan. 17 - Feb. 21, 2025, Fri.-Fri. On-line workshop: Rasch Measurement - Core Topics (E. Smith, Winsteps), www.statistics.com
May 16 - June 20, 2025, Fri.-Fri. On-line workshop: Rasch Measurement - Core Topics (E. Smith, Winsteps), www.statistics.com
June 20 - July 18, 2025, Fri.-Fri. On-line workshop: Rasch Measurement - Further Topics (E. Smith, Facets), www.statistics.com
Oct. 3 - Nov. 7, 2025, Fri.-Fri. On-line workshop: Rasch Measurement - Core Topics (E. Smith, Winsteps), www.statistics.com


Our current URL is www.winsteps.com

Winsteps® is a registered trademark