This Table compares the local (biased?) measure of one element with its measure from the main analysis. Zscore=, Bias=, Xtreme=, Arrange= and Juxtapose= control this Table.
+------------------------------------------------------------------------------------------------------------------------+
|Observd Expctd Observd Obs-Exp| Bias Model |Infit Outfit| Senior scientists Junior Scientis |
| Score Score Count Average| Size S.E. t d.f. Prob. | MnSq MnSq | Sq N Senior sc measr N Junior measr |
|---------------------------------+---------------------------------+------------+---------------------------------------|
| 4.2 7.91 1.5 -2.47| -1.00 .61 -1.63 1 .3496 | .6 .6 | 14 2 Brahe .21 5 Edward .34 |
|---------------------------------+---------------------------------+------------+---------------------------------------|
| 7.3 7.25 1.5 .01| .01 .56 .03 | .6 .6 | Mean (Count: 21) |
| 2.1 1.25 .0 .98| .42 .03 .72 | .4 .4 | S.D. (Population) |
| 2.1 1.28 .0 1.00| .43 .03 .73 | .4 .4 | S.D. (Sample) |
+------------------------------------------------------------------------------------------------------------------------+
Fixed (all = 0) chi-squared: 10.8 d.f.: 21 significance (probability): .97
--------------------------------------------------------------------------------------------------------------------------
The column headings mean:
Observd Score = raw score of the estimable responses involving these elements simultaneously, as observed in the data file.
Expctd Score = expected score based on the measures from the main analysis.
Observd Count = number of estimable responses involving these elements simultaneously.
Obs-Exp Average = observed score less the expected score divided by observed count, the bias in terms of the response metric. For rater behavior, look at the "Obs-Exp Average". If this is positive, then the rater is more lenient than expected in this situation. If this is negative, then the rater is more severe than expected.
Bias Size = Size of bias measure in log-odds units, logits, relative to overall measures. Only large or significant biases are listed greater than Zscore=. For clarification, compare the ranking of the Obs-Exp Average with that of the Bias Size. In this case, larger observed scores correspond to higher Bias sizes, i.e., higher abilities, higher leniencies, higher easiness. The sign of the report bias is controlled by Bias=. ">" indicates an extreme low score, "<" an extreme high score
For (measure+bias), add Bias Size to the element "measr", or subtract Bias Size from "measr". Addition for persons that are locally more able. Subtraction for items that are locally more difficult. Look at the "Obs-Exp Average".
Model Error = standard error of the bias estimate.
t = Student's t-statistic testing the hypothesis "There is no bias apart from measurement error". The "Obsvd Count"-2 approximates the degrees of freedom of the t-statistic. With many observations, the t-statistic approximates a normal distribution with mean = 0, S.D. = 1, i.e., a z-score. The t-statistic is the report of a test of the statistical significance of the size of the bias. In this table, statistically significant bias indicates that the difference between the element measure for this interaction and the overall element measure is greater than the difference we would expect to see by chance.
Infit MnSq and Outfit MnSq = Does the bias explain all the misfit reported in Table 7 or is there also another source of misfit? Values are expected to be less than 1.0 because the bias is explaining some of the overall misfit. These statistics do not report the fit of the bias terms. In effect, we are deliberately over-parameterizing the statistical model. Consequently we expect the mean-squares to be less than 1.0 (by an unknown amount). The reported mean-squares indicate how much of the misfit in Table 7 remains after the interactions are estimated. The reported mean-squares do not have the usual statistical properties of mean-squares (chi-squares) and so their statistical significance (Zstd) is unknown. The purpose of the mean-square fit statistics is to help you determine whether the misfit in the data is explained by the bias or is due to other causes. When there are choices for bias, such as raters and items, or raters and tasks, etc., this may help in choosing which bias to focus on: the one with the lowest mean-squares.
For each facet entering into the bias calculation:
Sq = a sequence number used to reference the bias term - useful for referring to a specific line in this Table.
N = element number with Facet. Only elements with non-extreme measures are included.
Senior Sc = Name of facet: elements listed below
measr = Measure of element from main analysis.
In the summary statistics,
Count = the number of modeled bias terms found in the data.
S.D. (Population) = the standard deviation if this sample is the whole population
S.D. (Sample) = the standard deviation if this sample is a random sample from the whole population
Fixed (all=0) chi-squared = A test of the "fixed effect" hypothesis: "Can this set of interactions be regarded as sharing the same measure of approximately 0.0 after allowing for measurement error?" The chi-squared value and degrees of freedom (d.f.) are shown. The significance is the probability that this "fixed" hypothesis is the case. This is not a test of "Can these interactions be disregarded?" Individual interactions may be large and significant. For instance, one bad tire in a production run of 1000 tires may not indicate a "statistically significant" problem in the production process, but I still don't want it on my car!
The chi-squares and t-tests evaluate hypothesis tests.
Think of driving along the road.
A.) Is this road surface generally OK?
Answer: Fixed (all = 0) chi-squared: 20 d.f.: 21 significance (probability): .5
So we can't reject the hypothesis that the road surface is generally OK.
B.) Are there any pot-holes we should avoid (even if the road is generally OK)?
Answer: the t-test Prob. for Brahe-David p=.02. This is a "pot-hole"!
Example using earlier Facets output:
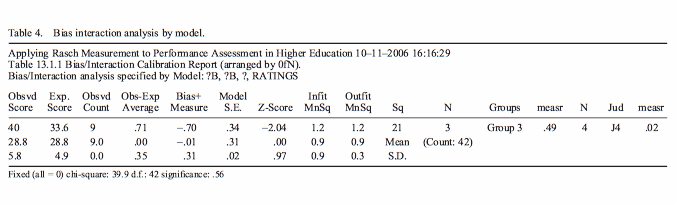
The observed score is 40. The expected score is 33.6. There are 9 observations. So, on average, Group 3 is being rated 0.71 score-points higher than expected by Judge J4. This corresponds to a change in judge severity of -.70 logits = less severe. The standard error is .34 logits. So the Z-score (t-test with infinite d.f.) is -2.04. The rater is significantly less severe (more lenient) at the .05 level (double-sided). If we want to report this as a change in group ability of +.71 logits, set Bias=Positive.
3-Way Interaction:
Model=
?,?B,?B,?,R9 ; 2-way interaction - also from Output Tables menu
?,?B,?B,?B,R9 ; 3-way interaction - only in Specification file: Models=
*
Table 13.2.1 Bias/Interaction Report (arranged by MN).
Bias/Interaction: 2. Essay, 3. Reader, 4. Session (higher score = higher bias measure)
+-------------------------------------------------------------------------------------------------------------------------------------+
|Observd Expctd Observd Obs-Exp| Bias+ Model |Infit Outfit| Essay Reader Session |
| Score Score Count Average| Size S.E. t d.f. Prob. | MnSq MnSq | Sq N E measr- Nu Re measr- Nu Session measr- |
|---------------------------------+---------------------------------+------------+----------------------------------------------------|
| 10 18.13 4 -2.03| -1.29 .46 -2.79 3 .0687 | .1 .1 | 70 1 A -.01 12 12 -.04 12 day 1 time 2 .00 |
| 10 17.52 4 -1.88| -1.21 .46 -2.62 3 .0790 | .4 .4 | 17 2 B .08 6 6 .11 11 day 1 time 1 .00 |
Measure of an Element of one Facet on an Element of Another Facet - such as Test-taker and Criterion
Produce Facets Table 13 from the Facets Output Tables menu: Test-takers by Criteria. For each combination of test-taker and Criterion, this shows the observed average rating and the bias size. You may be reporting bias in a positive or negative direction:
When the observed score is higher than the expected score, is the bias size positive?
If yes, add the bias size to the test-taker measure (at the right of the table) for the test-taker's measure on the criterion.
If no, subtract Add the bias size from the test-taker measure (at the right of the table) for the test-taker's measure on the criterion.
You can split Table 13 into columns by pasting it into Excel, and using Excel's "Data", "Text to columns" feature.
