Enhanced 64-bit Graph Display |
Standard 32-bit Graph Display |
Button or Slider |
Function |
Graph Box |
Standard or Enhanced - see Graphs menu |
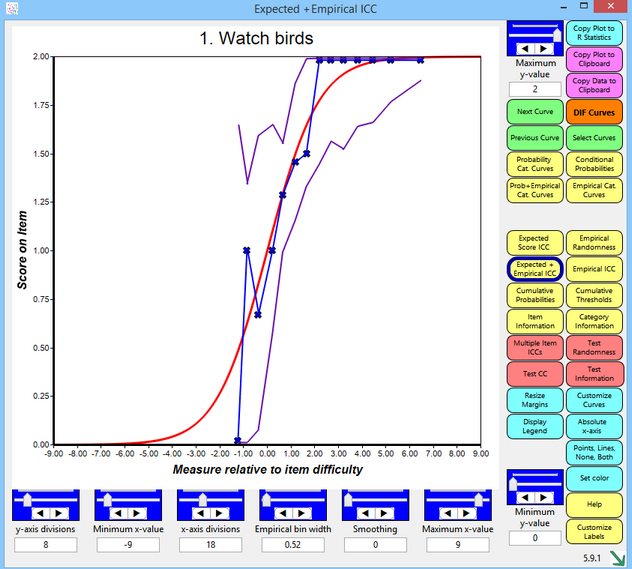
Title |
Item entry number and label, or depends on type of graph |
y-axis label and units |
depends on type of graph |
x-axis label |
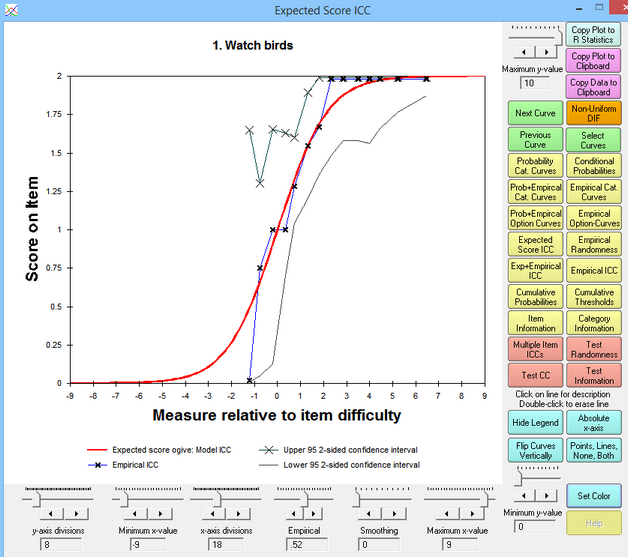
"Measure", person measures "Measure relative to item difficulty", (person measures - item difficulty) To switch from "Measure" to "Measure relative to item difficulty", click the blue button "Relative x-axis" To switch from "Measure relative to item difficulty" to "Measure", click the blue button "Absolute x-axis" |
x-axis units |
logits or user-scaled units |
legend below x-axis label |
displayed when blue "Display Legend" button is clicked |
32-bit: curve label |
click once on curve |
32-bit: hide curve |
double-click on curve. If all curves are hidden, then they are all re-displayed. |
Right-hand side: |
|
Maximum y-value |
Sets the maximum value on the vertical y-axis. Can be adjusted with slider, up-down arrows, or value in text box. |
One-click! launches R Statistics and displays the plot. |
|
Copy Plot to Clipboard
For better quality, see 32-bit: Graphs Window - bottom right 64-bit: drag bottom-right green arrow larger |
Copies the graph to the Windows clipboard. This only copies the part of the plot that is visible on your screen. Maximize the chart window and increase your screen resolution if the entire plot is not visible. To increase screen resolution: Windows "Start", "Settings", "Control Panel", "Display", "Settings" and move the "Screen resolution" slider to the right. Open a graphics or word-processing program, such as Paint or Word, or install the freeware: Irfanview.Then paste in the image for editing. To save the graphics plot in black-and-white, "Save As", "Black-and-white". For more options, see www.techjunkie.com/save-clipboard-image-as-jpg-png/ Copying many similar graphs can be expedited with a keyboard macro, such as autohotkey: www.autohotkey.com |
Copy Data to Clipboard |
Copies the graphed numbers to the Windows clipboard (for pasting into Excel, etc.) Use paste special to paste as a picture meta-file, bitmap or as a text listing of the data points. Each row corresponds to a set of points to plot: Column A - ignore (internal row identifier) Column B - x-axis for point on first curve: measure relative to item difficulty or relative to latent variable Column C - y-axis for point on first curve: probability, expected score, etc. Column D - x-axis for point on second curve: measure relative to item difficulty or relative to latent variable Column E - y-axis for point on second curve: probability, expected score, etc. etc. Scatterplot: Column C (y-axis) against Column B (x-axis) Column E (y-axis) against Column D (x-axis) etc. Combined plots: the curves on two or more Winsteps graphs can be combined into one Excel plot using "Copy Data" from the different graphs into one Excel worksheet. |
Next Curve |
Displays the same graph for the item with the next higher entry number. |
Displays the Rasch-model curve for the item and the empirical DIF curves for the DIF classifications groups when "Non-uniform DIF" is clicked on the Graphs Menu, |
|
Previous Curve |
Displays the same graph for the item with the next lower entry number. |
Select Curves |
Displays the graph for the selected item from the curve-selection-box: |
Probability Cat. Curves |
Displays the Rasch-model probability-curve for each response-category |
Displays the Rasch-model probability-curve for the relative probability of each adjacent pair of categories. These are dichotomous ogives. |
|
Prob+Empirical Cat. Curves |
Displays the Rasch-model probability-curve for each response-category, together with the empirical curve summarizing the data in each empirical interval. |
Displays the empirical curve for each response-category, summarizing the data in each empirical interval |
|
Prob+Empirical Option Curves |
Displays the Rasch-model probability-curve for each response-option, together with the empirical curve summarizing the data in each empirical interval. |
Displays the empirical curve for each response-option, summarizing the data in each empirical interval |
|
Displays the expected-score item characteristic curve, the item's Rasch-model logistic ogive. |
|
Displays the fit of the item, summarizing the data in each empirical interval |
|
|
Expected + Empirical ICC |
Displays the expected-score item characteristic curve, the item's Rasch-model logistic ogive, together with the empirical ICC summarizing the data in each empirical interval. |
Displays the item's empirical item characteristic curve, summarizing the data in each empirical interval. |
|
Displays the Rasch-model cumulative probability-curve for each response-category and the categories below it. Click on the "Flip Curves Vertically" button for the probability of each category and the categories above it. |
|
Cumulative Thresholds |
Display the probabilities of all categories up to and including each category, and also the probabilities of all the categories above each category. The curves cross on the 0.5 probability line at the cumulative threshold (Rasch-Thurstonian threshold) |
Displays the item-information function according to the Rasch model. |
|
Displays the information function for each category according to the Rasch model. |
|
Displays multiple Rasch-model and empirical item characteristic curves as selected in the ICC-selection box. |
|
Displays the fit of all the items in the test, summarizing the data in each empirical interval |
|
Displays the Rasch-model test characteristic curve (TCC), showing the relationship between raw scores and Rasch measures on the complete test of all active items. |
|
Displays the Test-Information Function (TIF) according to the Rasch model. The inverse square-root of the test information is the standard error of the Rasch person measure. |
|
Enhanced: Resize Margins |
Changes the left-side margin and the legend height, so they can be better displayed |
Enhanced: Customize Curves |
Hide unwanted curves and change colors of the curves |
Standard: Click on line for description |
Click on a curve to show its description below the graph. You can identify an individual traceline by single-left-clicking on it. Its description will then appear below the plot. Click elsewhere on the plot to remove the selection indicators. |
Standard: Double-click to erase line |
You can remove a traceline by double-left-clicking on it. Click on the command button, e.g., "Probability Curves", to return the plot to its initial appearance. |
Display Legend Hide Legend |
Click on "Display legend" to show descriptions of all the curves below the graph. Click on "Hide legend" to remove the descriptions. |
|
Relative x-axis |
Click on "Absolute x-axis" to show the graphs with measures (or raw scores) on the latent variable along the x-axis. Click on "Relative x-axis" to show the graphs with the x-axis plotted relative to the item difficulty. Multiple Item ICCs shows what happens for these two choices |
Flip Curves Vertically |
Reverses the cumulative probability curves on the y-axis |
Click on this button to show the empirical curves as both points("x") and lines, points only, lines only, and neither points nor lines. |
|
Adjust minimum Y-value |
Sets the minimum value on the vertical y-axis |
Smoothing |
Controls the degrees of smoothing of the empirical curve (jagged with "x") |
Set Color |
Click on a curve to select it, the click on "Set Color" to change its color using the color-selection-box. White makes the line disappear. |
Help |
Click on Help to display this page. |
Change Heading, x-axis label, y-axis label |
|
Across the bottom: left to right |
|
y-axis divisions |
Sets the number of tick-marked intervals on the y-axis |
Minimum x-value |
Sets the minimum value on the horizontal x-axis. To decrease the minimum possible X-value, set EXTREMESCORE= to a small value. |
x-axis divisions |
Sets the number of tick-marked intervals on the x-axis. Enhanced: zero (0) automatically assigns x-axis divisions |
Empirical interval |
Sets the number of empirical summary-intervals on the X-axis. Each observation, Xni, has an observed (empirical) value, such as 0 or 1 for a dichotomy, and also a measure on the rating scale = Ability of person n - Difficulty of item i. These observations are summarized into empirical intervals on the latent variable. Each summary is plotted as the mean of the observed values in the interval (y-axis) and the mean of the measures (x-axis). The maximum size of the interval is from the lowest measure for any observation to the highest measure for an observation. The minimum size of the interval is .01 logits. The difference between the maximum size and the minimum size is divided into roughly 100 increments. Using the empirical interval slider, or left-right arrows, changes the size of the interval. The current size of the interval is shown in "Empirical x.xx Interval" The 1-200 number of the empirical slider is a rough indicator of relative size, and can be ignored. |
Smoothing |
Smooths the empirical line, which is a series of points joined by line segments. Winsteps uses "cubic spines" for smoothing functions. |
Maximum x-value |
Sets the maximum value on the horizontal X-axis. To increase the maximum possible X-value, set EXTREMESCORE= to a small value. |
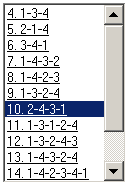
Curve selection Box |
|
||
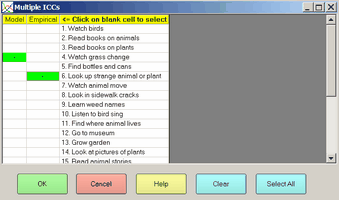
ICC Selection Box |
|
||
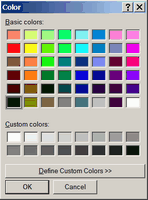
Color Selection Box |
|