Test information function:
A test information function is not produced by Facets, because there is not a unique of a definition of a "test" in a many-facet situation.
You can construct your own test information function using an Excel spreadsheet.
Open an Excel spreadsheet
When the Facets information function display, "Copy data to clipboard"
Then "Paste" into an Excel worksheet.
In another the Excel worksheet
In column A, enter measures for a wide range, e.g., -10 logits to +10 logits every .1 logit
In column B, locate the item difficulty of your first item
copy the information function column from the first worksheet (which centers on 0), and paste into the second work sheet so that it centers on the item's difficulty.
In column C, locate the item difficulty of your second item
copy the information function column from the first worksheet (which centers on 0), and paste into the second work sheet so that it centers on the item's difficulty.
In column D, (same again), etc.
When all the item information functions are entered into the spreadsheet.
Sum the rows (except column A) to give the test information
Plot the sum against column A to see the test information function.
1. Suppose you want the test information function based on all the elements in facet 3 (the items) of Guilford.txt.
Perform your facets analysis of Guilford.txt |
|
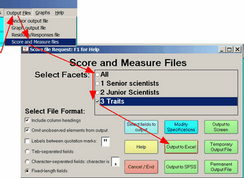
2. Facets menu bar Click on "Output Files" Click on "Score and measure files" Click on "All" to uncheck it. Click on your "test" facet Click on "Output to Excel" |
|
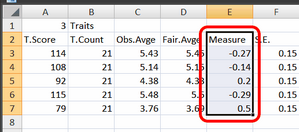
3. The Excel spreadsheet displays with the measures in Column E. Copy the measures.
|
|
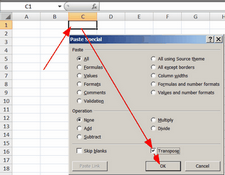
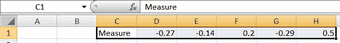
4. In a new Excel worksheet, put cursor in cell C1 paste-and-transpose the measures into the top row.
|
|
5. The first measure is in cell D1, going along the row |
|
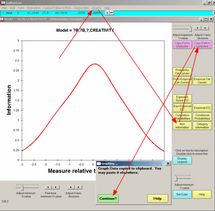
6. Facets menu bar Click on "Graphs" Click on "Item information" The item information function displays Click on "copy data to clipboard" "Graph data copied ..." Click on "Continue?" |
|
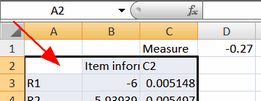
7. Excel worksheet (with measures) Paste into cell A2 Item information is in column C
|
|
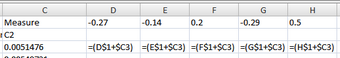
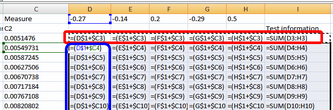
8. Excel In cell D3, enter the formula =(D$1+$C3) Copy this cell along row 3 for all the measures |
Press Ctrl+` (next to "1") to display the formulas |
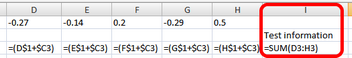
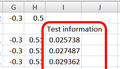
9. At the end of row 3 "sum" cells D3 to the last measure column. In the cell above the sum, enter "Test information" |
|
10. Copy the row of cells from D3 to the Sum. Paste into all the other rows (down to about row 201). |
|
11. The test information function is in the right-hand "summed" column |
|
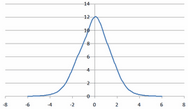
12. Scatter-plot the test information function. x-axis is column B y-axis is the "Test Information" column. |
|