PKMAP= can be used to customize Table 36 diagnostic maps. These maps are based on the KIDMAP - www.rasch.org/rmt/rmt82k.htm
|
||
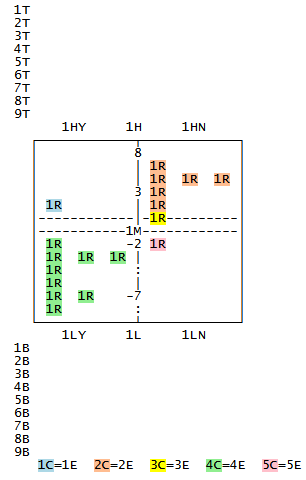
Figure: PKMAP field numbers and positions |
PKMAP= customization, see also ICOLORFILE= for more color options |
|
Format in Winsteps control file: ASCII=Webpage ; for the colored output PKMAP=* ; inline instructions for the PKMAP output in Table 36 (Field number)= value .... *
PKMAP Size The internal height of PKMAP grid box is 61 or MAXPAG= value - 8. The internal width of the PKMAP grid box is LINELENGTH= value - 6.
Format in text file: Edit/Create file with NOTEPAD to modify these settings. In text file, for example: 1D = Yes Save text file as MyPKMAP.txt in the same folder as the Control file Specification menu: PKMAP = MyPKMAP.txt |
||
Field code |
Values |
Meaning |
1CLICK = display button |
1CLICK = #LABEL# and codes below
1CLICK = (blank) to display all (the default) |
Click on button to display PKMAP
Click again to hide PKMAP
|
1T-9T = Top headings 1HY, 1H, 1HN = High side of grid 1M = Measure = Middle (ability) 1LY, 1L , 1LN = Low side of grid 1B-9B = Bottom footers 1E-5E = Color explanations |
(blank) |
do not display the field |
\ |
blank line |
|
text |
display the text in the field location |
|
#nnn# (can be included in text) |
display the statistic in the field location |
|
1R = Response = Rating |
(blank) or text or #nnn#, e.g., 1R = #LABEL# 1R = #CODE# 1R = #CAT# |
displays the response value positioned on the page Response code in the data file Scored category number For coloring based on 1R value, see ICOLORFILE= |
1MH = Mouse Hover |
1MH=".#LABEL#" |
when the Mouse pointer is hovered over the 1R value on a webpage, this value is displayed next to it:
|
1G = Grid for PKMAP layout |
Top left cell of grid is: HY High measure, Yes reached HN High measure, Not reached LY Low measure, Yes reached LN Low measure, Not reached |
Controls layout of the PKMAP by identifying the top left quadrant |
1C-5C = Color codes |
HTML color codes, e.g., light-green #E7C4A3 |
The color codes for text in the grid cells: 1C = High Yes (Current level) 2C = High No (Next level) 3C = 50-50 4C = Low Yes (Current level) 5C = Low No (Next level) |
1P = Placement of response |
F = Full-point thresholds (polytomies) D = Item difficulties (dichotomies) |
Vertical measure at which to place a response. |
1D = Display all the field numbers |
"Y" = Display field numbers and values at start of output |
The field codes and their values |
1F = Minimum mean-square to report |
0 = all mean-squares 1.5 = only persons with infit or outfit mean-squares greater than 1.5 are reported |
Selects only Kidmaps for misfitting response strings |
1S = Sort instructions |
n = Entry number descending N = Entry number ascending m = Measure descending M = Measure ascending f = Mean-square fit descending F = Mean-square fit ascending fI, FI = use Infit mean-square a = Alphabetical label descending A = Alphabetical label ascending |
Order of the PKMAP Kidmaps in the output table. |
1V-9V = Criterion lines |
numbers followed by L or U |
logit L or uscale U values for horizontal === lines across the grid. Useful for indicating cut-points, overall average performances, etc. |
1A = Ability lines |
00000 = no lines 10000 = Line at ability level 01000 = Line 1 S.E. above ability level 00100 = Line 1 S.E. below ability level 01100 = Both 1 S.E. lines (default) 00010 = Line 2 S.E. above ability level 00001 = Line 2 S.E. below ability level These can be combined |
show lines around 1M ability level |
Field number not in PKMAP= list |
none |
(ignored) |
Control variable= PSELECT=???A ; selection PDELETE=(list of entry numbers) PDFILE=(file of entry numbers)
|
value |
control variable for the PKMAP display |
ASCII=Webpage |
Format as a webpage |
|
#nnn# |
Value: 1= to 8= Person. 9= Item |
#NAME# or #LABEL# |
Name or label |
#ENTRY# |
Entry number |
#MEASURE# |
|
#COUNT# |
Total number of scored responses |
#SCORE# |
Total raw score |
#ERROR# |
Standard error of measure (user-rescaled by USCALE=, UDECIM=) |
#INMNSQ# |
Infit mean-square |
#INZSTD# |
Standardized Infit statistic: t standardized, locally t standardized, or log-scaled (LOCAL=) |
#OUTMNSQ# |
Outfit mean-square |
#OUTZSTD# |
Standardized Outfit statistic: t standardized, locally t standardized, or log-scaled (LOCAL=) |
#TITLE# |
TITLE= of this analysis |
#Y# |
Measure-units for each row (line) advance on vertical y-axis. |
Display the label substring: Example: 1R=#$S1W5#.#CODE# ; first 5 characters in the item label and the response code 1MH=#$S7W50# ; characters 7 onwards in the item label: "50" is more than the longest label |
|
## |
# |
#CENTER# |
Center this field (1T-9T and 1B-9B only) |
PKMAP= default values for dichotomies (True/False, Multiple-Choice)
PKMAP = *
1D = "No"
1F = "0"
1S = "N"
1T = " Name: #NAME#"
2T = " Ref. Number: #ENTRY# Measure: #MEASURE# S.E. #ERROR# Score: #SCORE#"
3T = " Test: #TITLE#"
4T = "\"
1G = "HY"
1P = "Half-point threshold"
1R = "#ENTRY#.#CAT#"
1HY = "Hard items answered correctly"
1H = "\<b\>\<i\>-Harder-\</b\>\</i\>"
1HN = "Hard items answered incorrectly"
1M = "\<FONT COLOR="RED"\>XXX\</FONT\>"
1LY = "Easy items answered correctly"
1L = "\<b\>\<i\>-Easier-\</b\>\</i\>"
1LN = "Easy items answered incorrectly"
1B = "\"
2B = "#CENTER#Each row is #Y# logits" "units" if USCALE<>0
3B = "\"
1E = "\<SPAN CLASS=1C\>blue\</SPAN\>=Unexpected Yes."
2E = " \<SPAN CLASS=2C\>orange\</SPAN\>=No."
3E = " \<SPAN CLASS=3C\>yellow\</SPAN\>=50/50."
4E = " \<SPAN CLASS=4C\>green\</SPAN\>=Yes."
5E = " \<SPAN CLASS=5C\>pink\</SPAN\>=Unexpected No."
1C = "lightblue"
2C = "#FFBD91"
3C = "yellow"
4C = "lightgreen"
5C = "pink"
; = = = "default values above. User-set values below."
*
PKMAP= default values for polytomies (Rating Scale, Partial Credit)
PKMAP = *
1D = "No"
1F = "0"
1S = "N"
1T = " Name: #NAME#"
2T = " Ref. Number: #ENTRY# Measure: #MEASURE# S.E. #ERROR# Score: #SCORE#"
3T = " Test: #TITLE#"
4T = "\"
1G = "HY"
1P = "Full-point threshold"
1R = "#ENTRY#.#CODE#"
1HY = "Hard levels reached"
1H = "\<b\>\<i\>-Higher-\</b\>\</i\>"
1HN = "Hard levels not reached"
1M = "\<FONT COLOR="RED"\>XXX\</FONT\>"
1LY = "Easy levels reached"
1L = "\<b\>\<i\>-Lower-\</b\>\</i\>"
1LN = "Easy levels not reached"
1B = "\"
2B = "#CENTER#Each row is #Y# logits" "units" if USCALE<>0
3B = "\"
1E = "\<SPAN CLASS=1C\>blue\</SPAN\>=Unexpected Yes."
2E = " \<SPAN CLASS=2C\>orange\</SPAN\>=No."
3E = " \<SPAN CLASS=3C\>yellow\</SPAN\>=50/50."
4E = " \<SPAN CLASS=4C\>green\</SPAN\>=Yes."
5E = " \<SPAN CLASS=5C\>pink\</SPAN\>=Unexpected No."
1C = "lightblue"
2C = "#FFBD91"
3C = "yellow"
4C = "lightgreen"
5C = "pink"
; = = = "default values above. User-set values below."
*
HTML codes can be used with \< and \> replacing < and >. HTML codes are ignored for text output.
Color: \<font color=red\>....\</font\> for HTML colors
or \<span class=1C\>....\</span\> for the colors defined in 1C, 2C, 3C, 4C, 5C
A list of color names is shown at https://www.w3schools.com/colors/colors_names.asp - Hex values can also be used. These color names and hex values are used for 1C-5C.
Bold: \<b\>...\</b\> but bold for 1M and 1R may cause misalignment. Use a color instead.
Italic: \<i\>...\</i\> but bold for 1M and 1R may cause misalignment. Use a color instead.
Example 1: Exam5.txt - dichotomy (Yes/No, True/False, Multiple-Choice Question) -
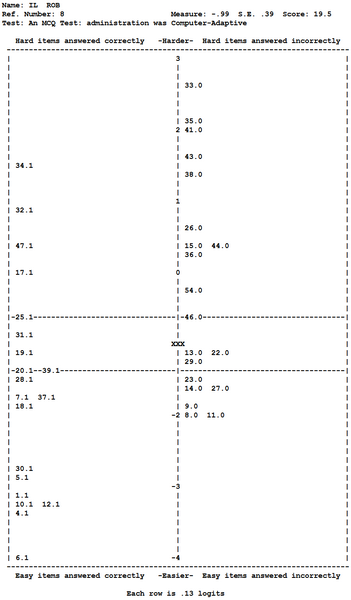
PKMAP (KIDMAP) text output - default settings: ASCII=Yes
|
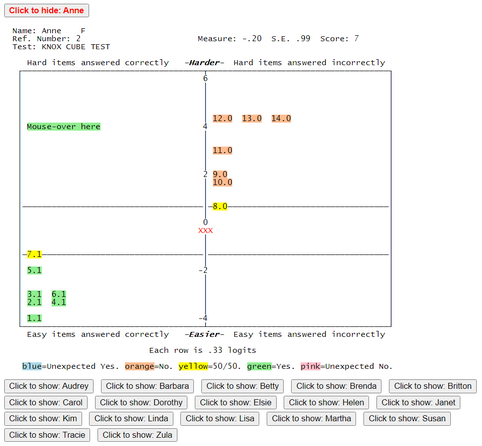
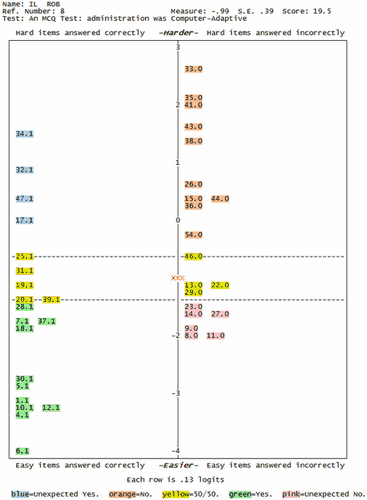
PKMAP (KIDMAP) webpage output - default settings: ASCII=Webpage
|
Example 2: Example0.txt - "Liking for Science" rating-scale
Name: M Rossner, Tr Cat
Ref. Number: 6 Measure: -.08 S.E. .34 Score: 24
Test: LIKING FOR SCIENCE (Wright & Masters p.18)
Hard levels reached -Higher- Hard levels not reached
-----------------------------------------------------------------------------
| 5 |
| | |
| | |
| 5.2 | |
| 23.2 | |
| | |
| 4 |
| | |
| | |
| | |
| | |
| Success | |
| 3 |
| | |
| | |
| | |
| | |
| | |
| 2 |
| 20.1 | |
| 4.1 | |
| | |
| | |
| 7.1 | |
| 1 |
| | |
| 9.1 | |
| 3.1 | |
|-6.1---------------------------------|-------------------------------------|
| 17.1 22.1 | |
| 12.2 0 |
| XXX <--Person ability |
| 19.2 | 1.1 8.0 24.1 |
|-------------------------------------|-15.1--------------------------------|
| | |
| | |
| 18.2 -1 11.1 |
| | |
| | 13.1 |
| | 10.1 16.0 25.0 |
| | 14.0 |
| | |
| -2 Failure |
| | |
| | |
| | |
| | |
| | 2.0 |
| -3 21.0 |
-----------------------------------------------------------------------------
Easy levels reached -Lower- Easy levels not reached
Each row is .17 logits
Responses are positioned vertically to match the expected scores in Table 2.2
Responses in the top category, here "2", always go in the left-hand column.
Responses in the bottom category, here "0", always go in the right-hand column.
Responses in intermediate categories, here "1", go in the left-hand column if they are above the person ability.
Responses in intermediate categories, here "1", go in the right-hand column if they are below the person ability.
Left column: success = higher rating on the rating scale
Item 18 (bottom left of PKMAP) is the easiest item. Person 6 rated in the top category 2. - a success - an "easy level reached"
"18.2" on the PKMAP is positioned at the ability level corresponding to that rating on that item.
"18.0" would have been much lower in the right-hand column.
Item 20 (upper left of PKMAP) is a hard item. Person 6 rated in the middle category 1. - a partial success - a "hard level reached"
"20.1" on the PKMAP is positioned at the ability level corresponding to that rating on that item.
"20.2" would have been much higher in the left-hand column.
"20..0" would have been much lower in the right-hand column.
Example 3: To display webpage maps by classroom:
ASCII=Webpage
@CLASS = class-identifying columns
TFILE=*
PSELECT=@CLASS=1
OFILE=CLASS1.HTM
36
PSELECT=@CLASS=2
OFILE=CLASS2.HTM
36
etc.
*
Example 4. Automating Example 3 for many classrooms. Here is a simple procedure:
1. Output the PFILE= to Excel
2. Delete all columns except the person label
3. On the person label column:
Excel: Data, Text-to-columns, Fixed format, and mark the classroom codes, OK
so now the classroom codes are in a column by themselves, say column U
4. Select the classroom codes
5. Insert pivot table
6. Location of pivot table column V
Add to report: check box
Pivot table output to column V
7. Copy the unique classroom codes from column V to columns B and D
8. Arrange the columns:
blank column ( column A)
classroom codes (column B)
blank column (column C)
classroom codes again (column D)
blank column (column E)
9. Fill column A with
%PSELECT=@CLASS=
10. Fill column C with
%OFILE=CLASS-
11. Fill column E with
.HTM%36
So now row 1 looks like:
%PSELECT=@CLASS= 1 %OFILE=CLASS- 1 .HTM%36
12. Combine cols A-E into column F. Fill column F with
=CONCATENATE(A1, B1, C1, D1, E1)
Column E looks like:
%PSELECT=@CLASS=1%OFILE=CLASS-1.HTM%36
13. Copy column E into Microsoft Word
14. In Microsoft Word, replace % with a new-line code ^p
The column in Word now looks like
PSELECT=@CLASS=1
OFILE=CLASS-1.HTM
36
15. Save this to a separate text file, mytfile.txt
16. In your Winsteps control file, put
TFILE=mytfile.txt
