A better plot may result from copying Facets graph coordinates, see "Copy Plot Data to Clipboard".
From the Output Files menu, "Graph output file" provides the values plotted in Table 8 for the probability curves and expected score ogive. Also produced by Graphfile=.
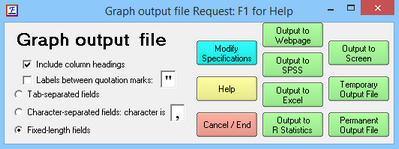
For help with this dialog box, see Output Dialog Box.
The output is in fixed column format or, if comma-separated values are preferred, specify "filename, CSV" or CSV=Y. For Tab-separated values, specify "filename, Tab" or CSV=Tab
Output to SPSS, Excel and R Statistics are in their native-format. Excel and R Statistics are launched.
Heading lines= controls display of heading lines. QM quotation marks, controls whether labels are withing quotation marks.
Modify Specifications provides further options
The fixed column format is:
Field |
Columns |
Contents |
1 |
1-10 |
Scale number (matches Sub-Table number for Table 8) |
2 |
11-20 |
Measure (X-Axis) |
3 |
21-30 |
Expected Score |
4 |
31-40 |
Category value corresponding to expected score |
5 |
41-50 |
Probability for bottom category |
6 |
51-60 |
Probability for second category |
7 ... |
61-70, ... |
Probabilities for higher categories |
Scale Measure Expected ExpCat Prob:1 Prob:2 Prob:3 Prob:4 Prob:5 Prob:6 Prob:7 Prob:8 Prob:9
1 -6.0000 1.0307 1 .9697 .0299 .0004 .0000 .0000 .0000 .0000 .0000 .0000
1 -5.9880 1.0311 1 .9693 .0303 .0004 .0000 .0000 .0000 .0000 .0000 .0000
1 -5.9759 1.0315 1 .9689 .0307 .0004 .0000 .0000 .0000 .0000 .0000 .0000
Example:Provide coordinates so I can plot beautiful probability curves using my graphics package:
Graphfile=plot.dat,CSV; the name of an output file with comma-separated values, produces, for a 3 category rating scale (or partial credit):
